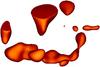
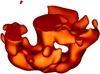
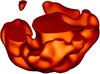
Fig. 9
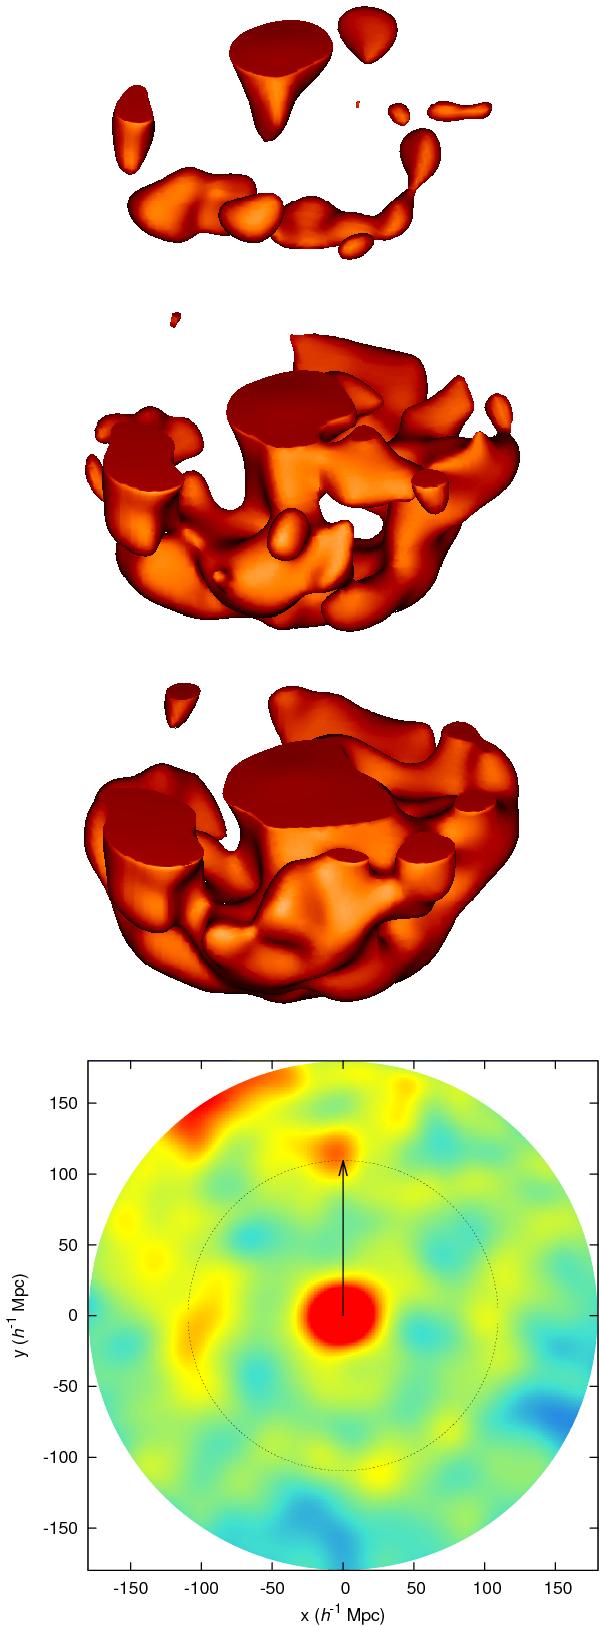
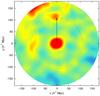
Stacked 3D and 2D density fields. In the top three panels, we show the density field after stacking the Nr centres with WRmax,smax > 0. We show surfaces encompassing the regions above different thresholds in density after an isotropic Gaussian smoothing with σ = 10 h-1 Mpc. The density threshold decreases from top to bottom, with values of δ = 1.24,1.18,1.13 (δ is the density relative to the average density of the sample). We show only the bottom half of the density field for clarity. It can be seen that the acoustic shell clearly appears around the central over-density at the detected horizon scale. A 2D slice of this density field is shown in the bottom panel. Here, the dotted line is a circle whose radius corresponds to the one we measure for the BAO shells, rmax = 109.5 h-1 Mpc, and the arrow marks the direction of the line of sight.
Current usage metrics show cumulative count of Article Views (full-text article views including HTML views, PDF and ePub downloads, according to the available data) and Abstracts Views on Vision4Press platform.
Data correspond to usage on the plateform after 2015. The current usage metrics is available 48-96 hours after online publication and is updated daily on week days.
Initial download of the metrics may take a while.