Fig. 6
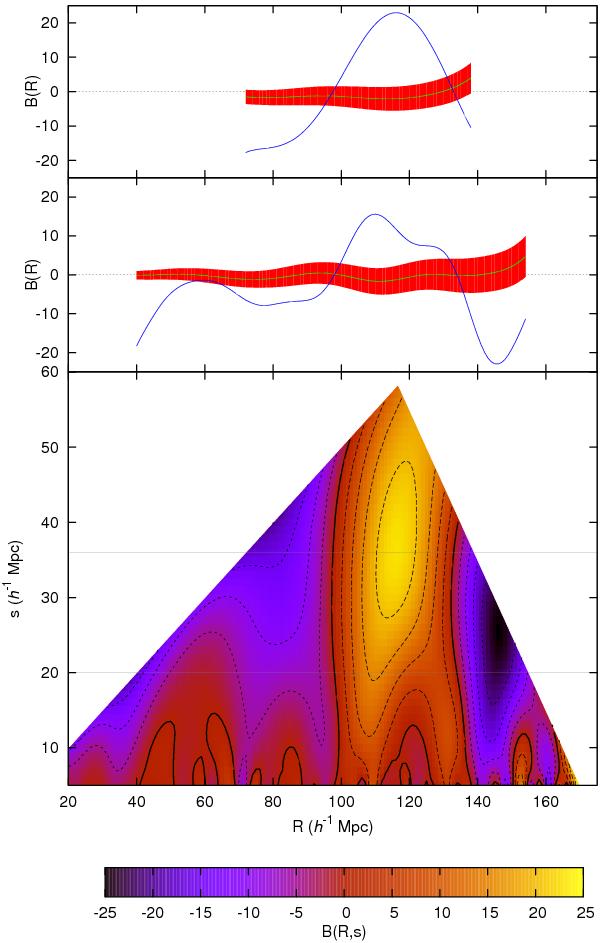
The BAOlet statistic B calculated for SDSS data as a function of the parameters (R,s). The bottom panel shows the results in the full parameter space considered, where we sampled both R and s at intervals of 1 h-1 Mpc. We mask two areas, at the upper right and left corners, where our results are not reliable (see details in the text). The contours are drawn in steps of 5 for B < 0 (dotted), B = 0 (solid), and B > 0 (dashed). The top two panels show cuts at the arbitrarily chosen values s = 36 h-1 Mpc (top) and s = 20 h-1 Mpc (middle), marked with grey horizontal lines in the 2D panel. In these panels, the blue line is B(R,s), while the green line and the red band show the mean ( ) and 1-σMC interval for the Monte Carlo realisations of random centres. We obtain a clear significant peak at different values of s, with a maximum for R = 116 h-1 Mpc, s = 36 h-1 Mpc.
Current usage metrics show cumulative count of Article Views (full-text article views including HTML views, PDF and ePub downloads, according to the available data) and Abstracts Views on Vision4Press platform.
Data correspond to usage on the plateform after 2015. The current usage metrics is available 48-96 hours after online publication and is updated daily on week days.
Initial download of the metrics may take a while.