Fig. 3
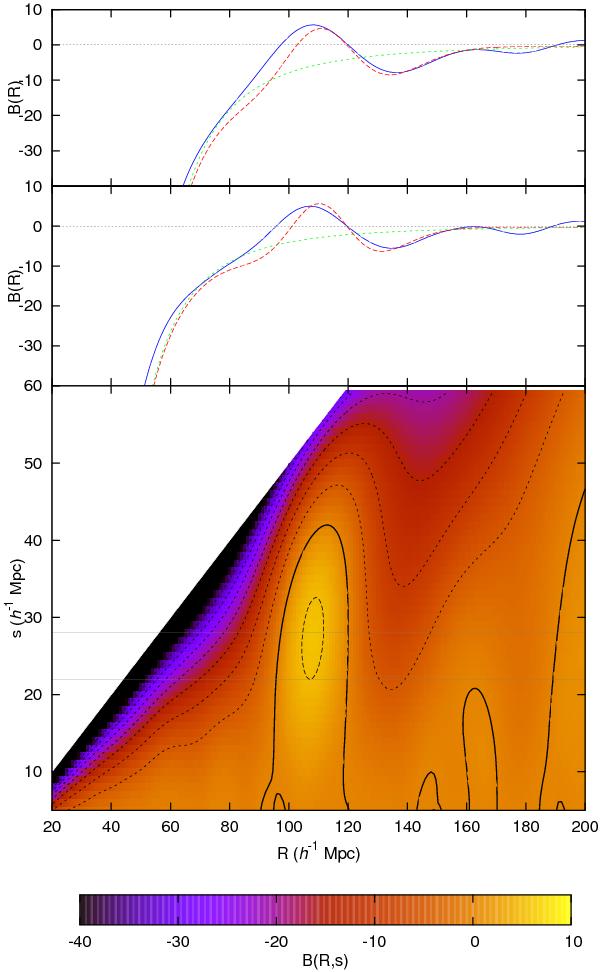
The BAOlet statistic B calculated for the MICE simulation sample described in the text as a function of the parameters (R,s) (bottom panel). The contours are drawn in steps of 5 for B < 0 (dotted), B = 0 (solid), and B > 0 (dashed). This function attains its maximum for R = 108 h-1 Mpc, s = 28 h-1 Mpc. The top two panels show cuts at the values s = 28 h-1 Mpc (top) and s = 22 h-1 Mpc (middle), marked with grey horizontal lines in the 2D panel. In each case, the solid blue line corresponds to the value obtained from MICE, the dashed red line corresponds to the theoretical expectation from the Eisenstein & Hu (1998) transfer function (bottom panel of Fig. 2), and the dotted green line to the theoretical expectation using the “no wiggle” transfer function (top panel of Fig. 2). These theoretical predictions have been re-normalised to get the same value at the maximum in B(R,s).
Current usage metrics show cumulative count of Article Views (full-text article views including HTML views, PDF and ePub downloads, according to the available data) and Abstracts Views on Vision4Press platform.
Data correspond to usage on the plateform after 2015. The current usage metrics is available 48-96 hours after online publication and is updated daily on week days.
Initial download of the metrics may take a while.