Fig. 2
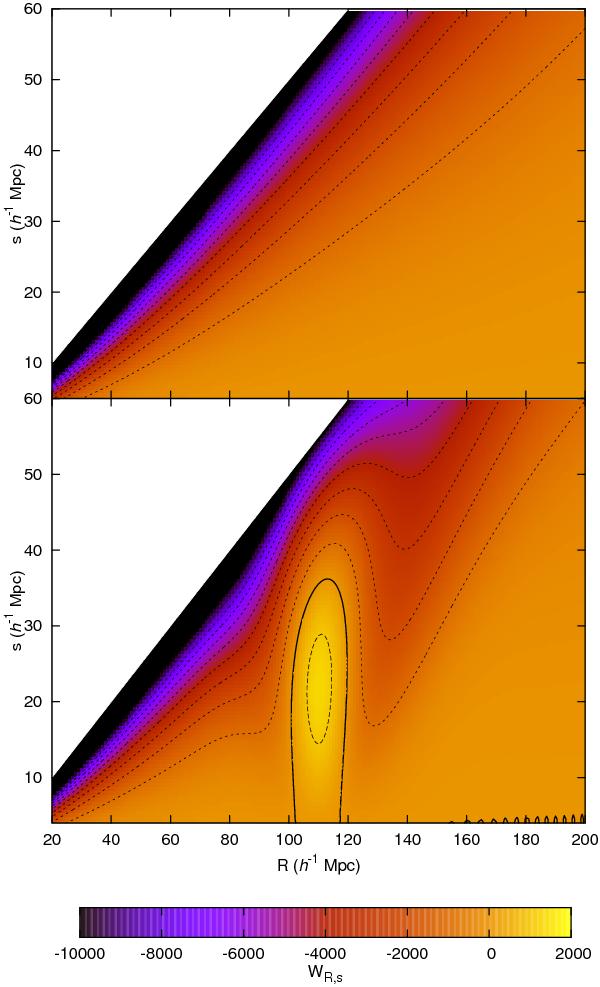
Values of the BAOlet coefficients WR,s expected at the positions of large initial point-like perturbations, as a function of the BAOlet parameters (R,s). The bottom panel shows the result using a standard ΛCDM transfer function, while the top panel shows the result using a transfer function with the BAO wiggles edited out (Eisenstein & Hu 1998). The normalisation is arbitrary. The contours are drawn in steps of 1000 for WR,s < 0 (dotted), WR,s = 0 (solid), and WR,s > 0 (dashed). The map attains a maximum at R = 110 h-1 Mpc, s = 22 h-1 Mpc.
Current usage metrics show cumulative count of Article Views (full-text article views including HTML views, PDF and ePub downloads, according to the available data) and Abstracts Views on Vision4Press platform.
Data correspond to usage on the plateform after 2015. The current usage metrics is available 48-96 hours after online publication and is updated daily on week days.
Initial download of the metrics may take a while.