Fig. 10
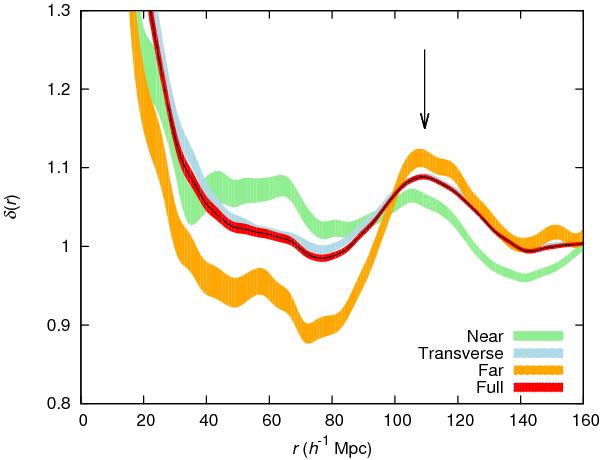
Average radial profiles. We show the radial density profile averaged over the Nr centres with WRmax,smax > 0. We plot  , where ρ0 is the average density of the sample. The continuous line with a red error band shows the radial profile for the full sphere. We also show the error bands for the radial profile restricted to regions of the sphere, as defined in the text: the “near” region (green), the “far” region (orange), and the “transverse” region (blue). The arrow signals the location of the maximum, rmax = 109.5 h-1 Mpc. The error band corresponds to the 1-σ dispersion of 1000 bootstrap realisations. The profiles were estimated using a B3 kernel of width h = 4 h-1 Mpc in the radial coordinate, but similar results are obtained when using slightly different widths or shapes of the kernel.
Current usage metrics show cumulative count of Article Views (full-text article views including HTML views, PDF and ePub downloads, according to the available data) and Abstracts Views on Vision4Press platform.
Data correspond to usage on the plateform after 2015. The current usage metrics is available 48-96 hours after online publication and is updated daily on week days.
Initial download of the metrics may take a while.