Fig. 1
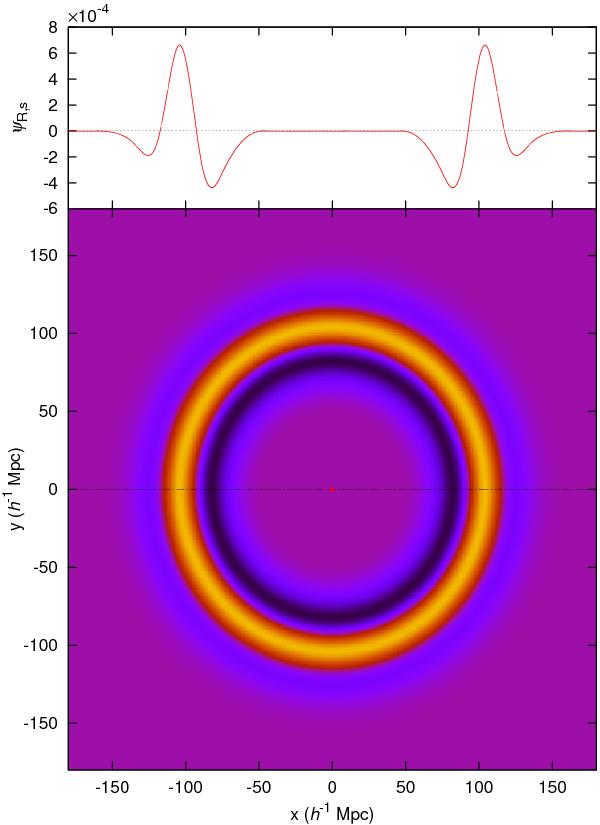
The BAOlet function. Here we show a two-dimensional (2D) plot (bottom) of the wavelet ψR,s(x) used in the analysis, as defined by Eq. (1). The top panel shows a 1D slice along the dashed-dotted axis. The wavelet is plotted here for R = 105 h-1 Mpc, s = 30 h-1 Mpc. The red dot marks the centre of the wavelet. This function has a null mean (provided that R > 2s), and compact support. It takes non-zero values only for R − 2s ≤ |x| ≤ R + 2s.
Current usage metrics show cumulative count of Article Views (full-text article views including HTML views, PDF and ePub downloads, according to the available data) and Abstracts Views on Vision4Press platform.
Data correspond to usage on the plateform after 2015. The current usage metrics is available 48-96 hours after online publication and is updated daily on week days.
Initial download of the metrics may take a while.