Free Access
Fig. 8
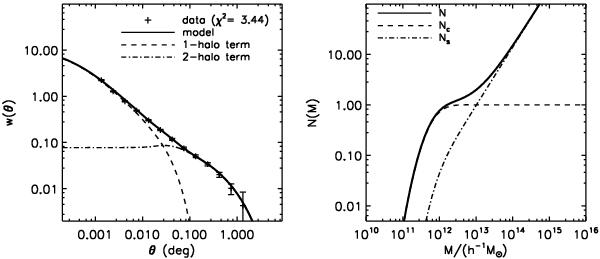
Example of a measured w(θ) (for all galaxies in the redshift range 0.4 < z < 0.6 and for Mg − 5log h < −19.8), as well as the best-fitting model, as described in Sect. 4. Left: w(θ) measurement and model. Right: N(M), showing the central term Ncent and the satellite term Ns.
Current usage metrics show cumulative count of Article Views (full-text article views including HTML views, PDF and ePub downloads, according to the available data) and Abstracts Views on Vision4Press platform.
Data correspond to usage on the plateform after 2015. The current usage metrics is available 48-96 hours after online publication and is updated daily on week days.
Initial download of the metrics may take a while.