Fig. 6
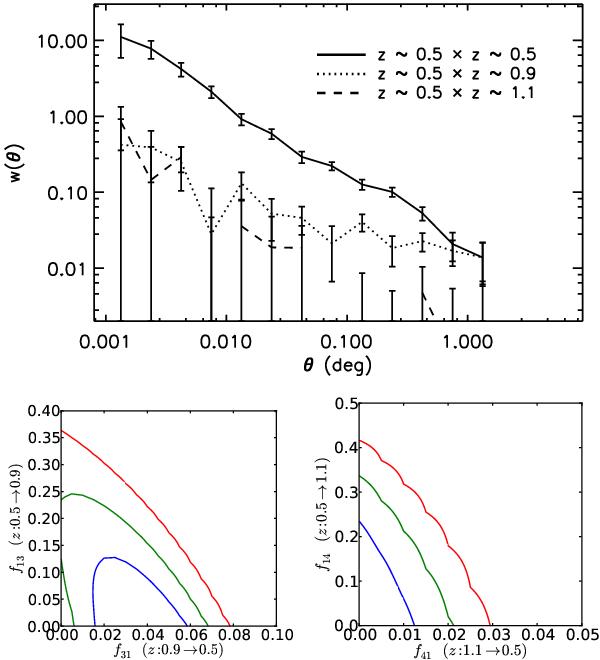
Cross correlation analysis between redshift bins for the full sample. Top: auto-correlation in the redshift bin 0.4 < z < 0.6 (straight line) and cross-correlation between the bins 0.4 < z < 0.6 and 0.8 < z < 1.0 (dotted line) and between 0.4 < z < 0.6 and 1.0 < z < 1.2 (dashed line). Bottom: quantitative estimates of the contamination (percentage of galaxies scattered) from a pairwise analysis between redshift bins 0.4 < z < 0.6 and 0.8 < z < 1.0 (left) and between 0.4 < z < 0.6 and 1.0 < z < 1.2 (right). The contours show the 68.3 (blue), 95.5 (green) and 99.7 (red) confidence regions.
Current usage metrics show cumulative count of Article Views (full-text article views including HTML views, PDF and ePub downloads, according to the available data) and Abstracts Views on Vision4Press platform.
Data correspond to usage on the plateform after 2015. The current usage metrics is available 48-96 hours after online publication and is updated daily on week days.
Initial download of the metrics may take a while.