Fig. 3
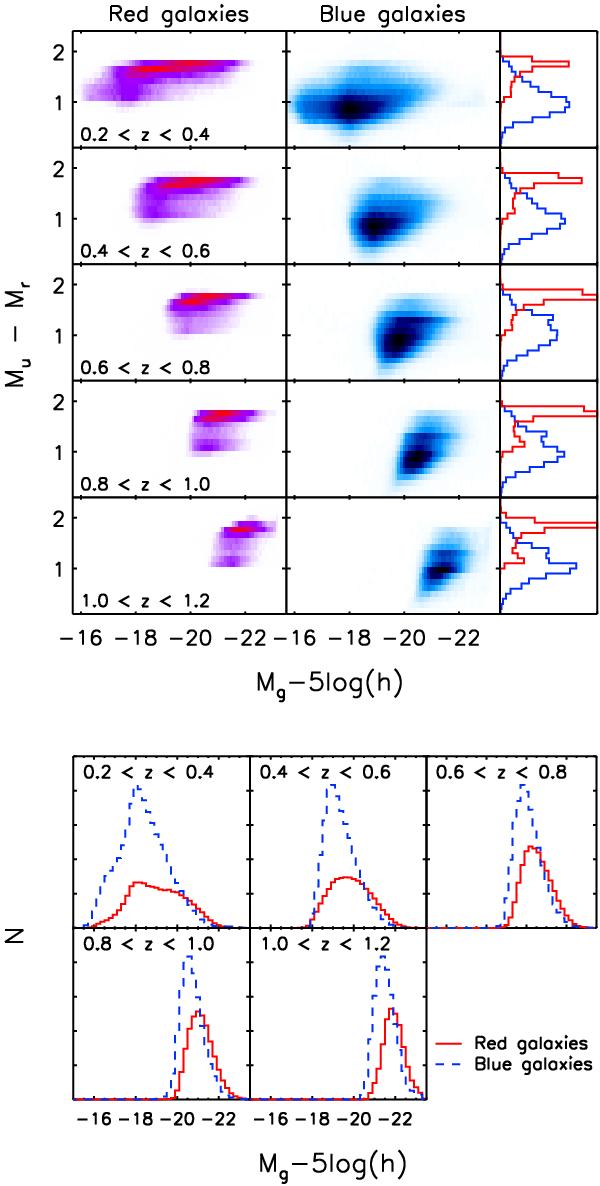
Top: type selection based on best fitting templates for the “red” sample (left) and the “blue” sample (right) in the CFHTLS Wide. We show the colour distribution (Mu − Mr) as function of absolute magnitude (Mg) and redshift (top to bottom) and number counts for “red” and “blue” objects on the right panels. Bottom: number of red and blue galaxies as function of magnitude and redshift.
Current usage metrics show cumulative count of Article Views (full-text article views including HTML views, PDF and ePub downloads, according to the available data) and Abstracts Views on Vision4Press platform.
Data correspond to usage on the plateform after 2015. The current usage metrics is available 48-96 hours after online publication and is updated daily on week days.
Initial download of the metrics may take a while.