Fig. 18
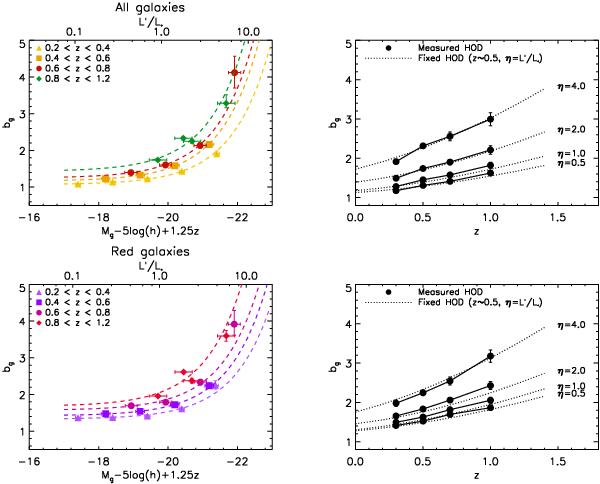
Galaxy bias as function of luminosity and redshift. Left panels: bias for full and red samples (top and bottom panels) as function of corrected luminosity threshold L′. The dashed line represents Eq. (29). Right panels: computed bias for several luminosity threshold samples  as function of redshift. Error bars were derived from the parametric form shown on the left (dashed line), whereas the dotted lines show the bias evolution computed from our model, assuming a redshift-independent HOD parameter set.
Current usage metrics show cumulative count of Article Views (full-text article views including HTML views, PDF and ePub downloads, according to the available data) and Abstracts Views on Vision4Press platform.
Data correspond to usage on the plateform after 2015. The current usage metrics is available 48-96 hours after online publication and is updated daily on week days.
Initial download of the metrics may take a while.