Fig. 16
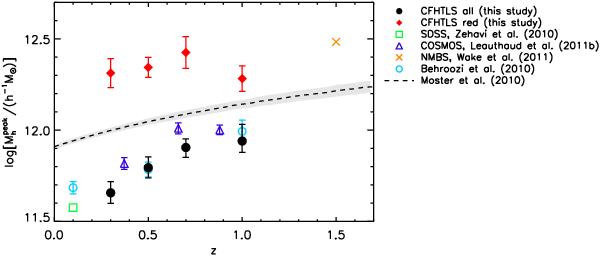
Position of the peak  corresponding to
  for the full (filled circles) and red (filled diamonds) samples as function of redshift. Error bars are derived from the nearest data point to the peak. We compare our results with measurements in SDSS (Zehavi et al. 2011), in COSMOS (Leauthaud et al. 2012b) and in the NEWFIRM Medium Band Survey (NMBS, Wake et al. 2011). We convert M200 halo masses (corresponding to a sphere with overdensity 200 times the background density) into virial masses Mvir (our definition) using the method described in Appendix C of Hu & Kravtsov (2003). We also display numerical predictions based on abundance-matching method from Behroozi et al. (2010) and Moster et al. (2010), where the shaded region shows the 1 − σ uncertainty.
Current usage metrics show cumulative count of Article Views (full-text article views including HTML views, PDF and ePub downloads, according to the available data) and Abstracts Views on Vision4Press platform.
Data correspond to usage on the plateform after 2015. The current usage metrics is available 48-96 hours after online publication and is updated daily on week days.
Initial download of the metrics may take a while.