Fig. 15
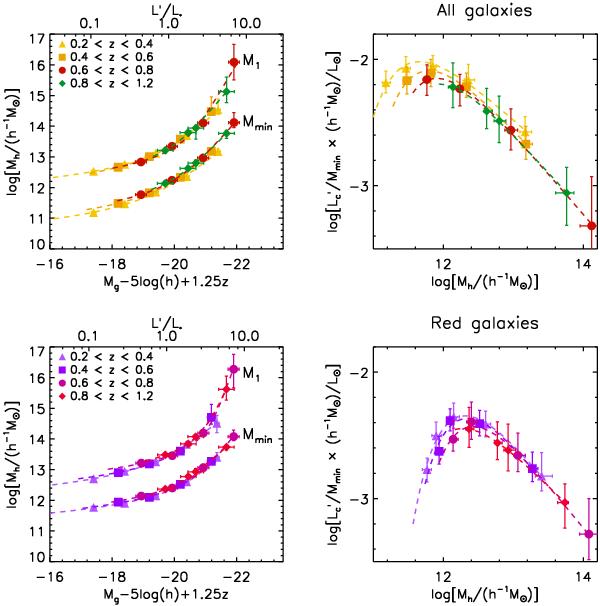
Left panels: halo mass estimates Mmin and M1 for all (top) and red (bottom) galaxy samples, as function of luminosity threshold, corrected for passive redshift evolution to approximate stellar mass selected samples. The dashed lines correspond to Eq. (25). Right panels: light-to-halo mass ratios  (Eq. (26) with identical parameters as those fitted with Eq. (25)) as function of halo mass.
Current usage metrics show cumulative count of Article Views (full-text article views including HTML views, PDF and ePub downloads, according to the available data) and Abstracts Views on Vision4Press platform.
Data correspond to usage on the plateform after 2015. The current usage metrics is available 48-96 hours after online publication and is updated daily on week days.
Initial download of the metrics may take a while.