Fig. 13
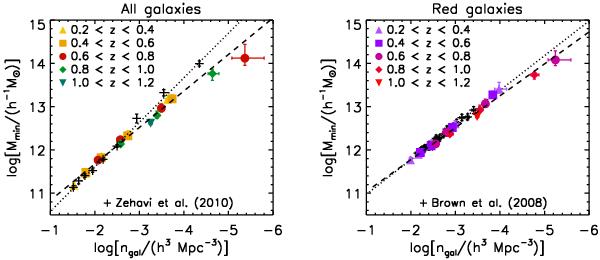
Mmin as a function of galaxy number density for all (left) and red (right) galaxies. The dashed line in each panel represents a power law fit to the data, and the dotted line represents a power law fit to the results given in Brown et al. (2008) (red galaxies) and in the SDSS by Zehavi et al. (2011) (all galaxies). We converted M200 halo masses to virial masses Mvir when necessary.
Current usage metrics show cumulative count of Article Views (full-text article views including HTML views, PDF and ePub downloads, according to the available data) and Abstracts Views on Vision4Press platform.
Data correspond to usage on the plateform after 2015. The current usage metrics is available 48-96 hours after online publication and is updated daily on week days.
Initial download of the metrics may take a while.