Free Access
Fig. 12
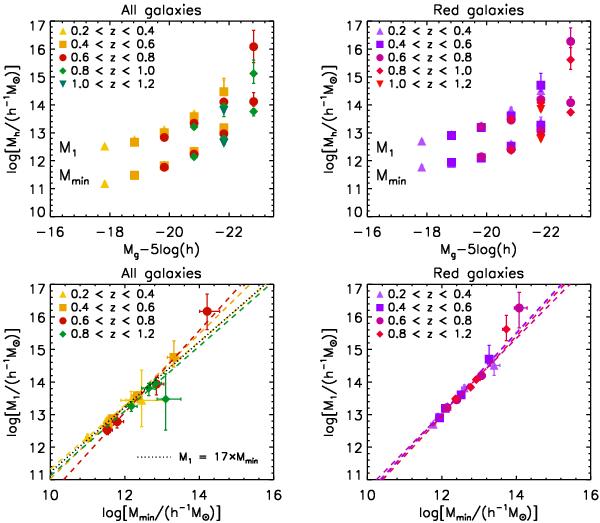
Top panels: halo mass estimates Mmin and M1 for all (left) and red (right) galaxy samples as function of luminosity threshold (Mg). Bottom panels: M1 versus Mmin in different redshift bins. The dotted lines represent a linear relation and the dashed lines are a power-law fit to M1 versus Mmin in each redshift bin.
Current usage metrics show cumulative count of Article Views (full-text article views including HTML views, PDF and ePub downloads, according to the available data) and Abstracts Views on Vision4Press platform.
Data correspond to usage on the plateform after 2015. The current usage metrics is available 48-96 hours after online publication and is updated daily on week days.
Initial download of the metrics may take a while.