Free Access
Fig. 1
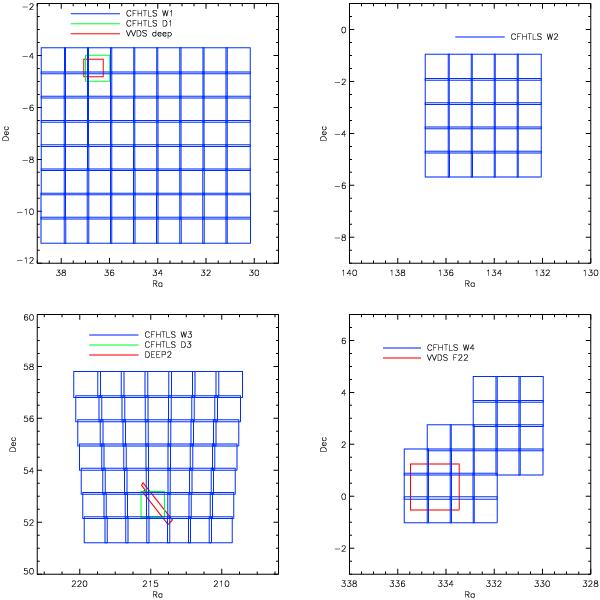
Sky coverage of W1, W2, W3 and W4 fields. Each blue square represents one MegaCam pointing. Spectroscopic data (VVDS F02, F22, and DEEP2) are in red. CFHTLS Deep fields overlapping with the wide survey (D1 and D3) are shown in green.
Current usage metrics show cumulative count of Article Views (full-text article views including HTML views, PDF and ePub downloads, according to the available data) and Abstracts Views on Vision4Press platform.
Data correspond to usage on the plateform after 2015. The current usage metrics is available 48-96 hours after online publication and is updated daily on week days.
Initial download of the metrics may take a while.