Fig. 7
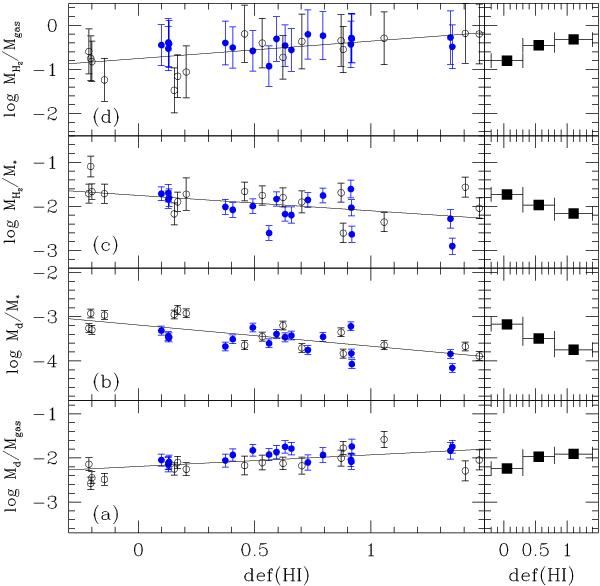
The dust-to-gas ratio, dust-to-stellar mass ratio, molecular-to-stellar mass ratio and the molecular fraction as a function of the HI deficiency. Panels to the left show the data with symbols as in previous figures: filled circles are galaxies in the M-sample, open circles are galaxies in the S-sample. Continuous lines in each panel are best fits to linear relation between def(HI) and the variable shown on the y-axis. Panels to the right of the figure show mean values in three HI deficiency bins.
Current usage metrics show cumulative count of Article Views (full-text article views including HTML views, PDF and ePub downloads, according to the available data) and Abstracts Views on Vision4Press platform.
Data correspond to usage on the plateform after 2015. The current usage metrics is available 48-96 hours after online publication and is updated daily on week days.
Initial download of the metrics may take a while.