Free Access
Fig. 3
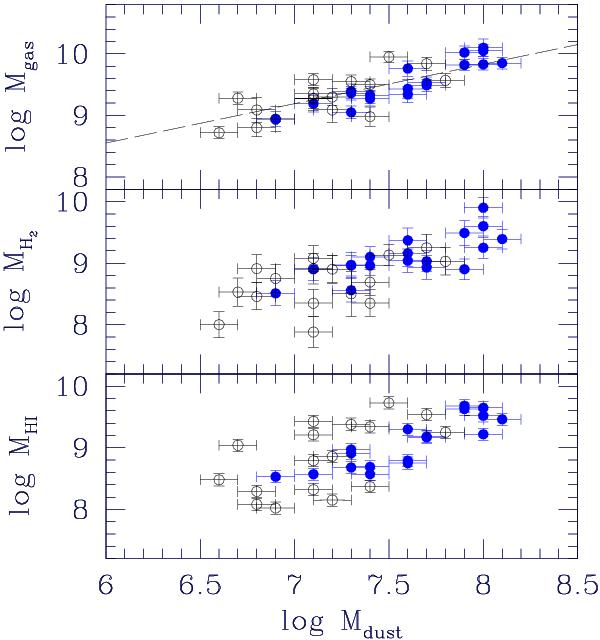
The relation between dust and gaseous masses (HI, H , and total gas mass in solar mass units) for the whole sample. Filled and open circles are for galaxies in the M-sample, and S-sample, respectively. The dashed line in the upper panel is the best-fit linear relation for the data shown.
Current usage metrics show cumulative count of Article Views (full-text article views including HTML views, PDF and ePub downloads, according to the available data) and Abstracts Views on Vision4Press platform.
Data correspond to usage on the plateform after 2015. The current usage metrics is available 48-96 hours after online publication and is updated daily on week days.
Initial download of the metrics may take a while.