Free Access
Fig. 12
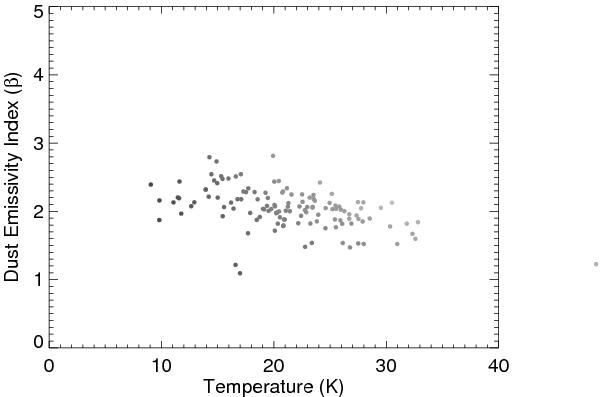
Fits of Td and β using simulated data, similar to Fig. 11. We used the fitted temperatures from Table 3 to create the simulated data, and β = 2.0. Shown is one of 1000 trials using different simulated calibration errors. Colors indicate the input temperature to the simulated SEDs: black is ~10 K and light gray is ~35 K.
Current usage metrics show cumulative count of Article Views (full-text article views including HTML views, PDF and ePub downloads, according to the available data) and Abstracts Views on Vision4Press platform.
Data correspond to usage on the plateform after 2015. The current usage metrics is available 48-96 hours after online publication and is updated daily on week days.
Initial download of the metrics may take a while.