Fig. 3
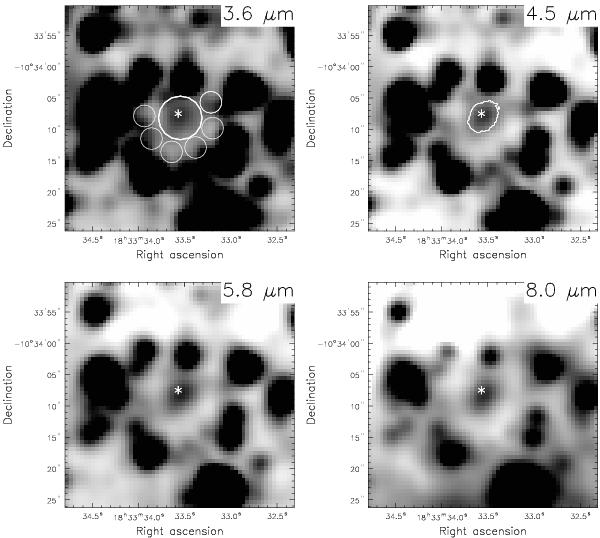
IRAC images of the central region of SNR G21.5-0.9: 3.6 μm – top left, 4.5 μm – top right, 5.8 μm – bottom left and 8.0 μm – bottom right. All panels cover the same field of view. Contours in the 4.5 μm image show the extent of the compact nebula as seen with Chandra HRC (Camilo et al. 2006). The star marks the position of PSR J1833-1034. In the top left panel circles depict: large central circle – flux extraction region for the compact nebula; smaller circles: regions where the background level was estimated. These regions were used for measuring the flux in all IRAC bands (see Sect. 3.2). Each image was smoothed with a 2-dimensional Gaussian with FWHM = 1.8′′.
Current usage metrics show cumulative count of Article Views (full-text article views including HTML views, PDF and ePub downloads, according to the available data) and Abstracts Views on Vision4Press platform.
Data correspond to usage on the plateform after 2015. The current usage metrics is available 48-96 hours after online publication and is updated daily on week days.
Initial download of the metrics may take a while.