Fig. 2
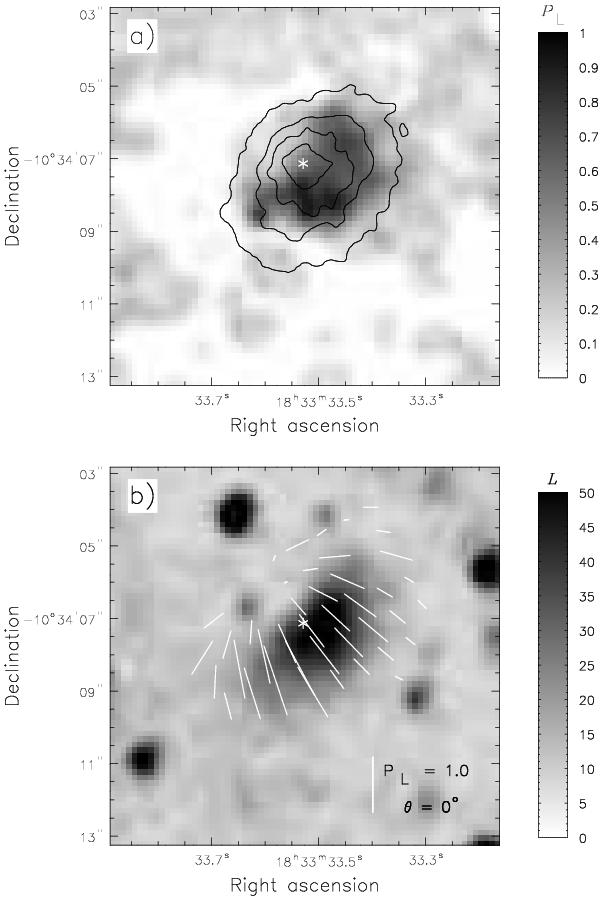
a) Linear polarisation degree PL map of the compact core region of SNR G21.5-0.9. The map was constructed using polarimetric imaging observations performed with VLT/ISAAC and was smoothed using a 2-dimensional Gaussian with FWHM = 0.45′′. Colour-coded is the measured value of PL. Contours show the extent of the compact core seen with Chandra HRC (Camilo et al. 2006). b) Map of linearly polarised intensity  smoothed with a 2-dimensional Gaussian with a FWHM = 0.45′′. Colour-coded is the measured value of L. White bars represent electric field vectors with their length proportional to the linear polarisation fraction PL and their orientation defined by the polarisation angle θ. A vertical bar placed in the bottom right corner, for reference, shows an electric field vector with PL = 1 and θ = 0°. In both panels a star shows the pulsar’s position.
Current usage metrics show cumulative count of Article Views (full-text article views including HTML views, PDF and ePub downloads, according to the available data) and Abstracts Views on Vision4Press platform.
Data correspond to usage on the plateform after 2015. The current usage metrics is available 48-96 hours after online publication and is updated daily on week days.
Initial download of the metrics may take a while.