Fig. 2
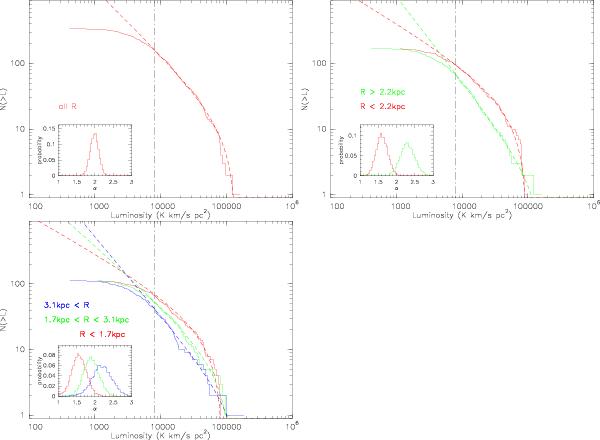
Cumulative luminosity distributions for the GMCs in M 33. The upper left panel includes clouds at all radii in a single luminosity function; the upper right panel divides the cloud sample into two equal samples separating the inner disk clouds from those at larger radii. The lower panel divides the sample into three parts (see Table 1 for numerical results). In each panel, the range in radii for each curve is indicated following the color coding of the curves. The solid curves represent the real data, whereas the dashed lines represent the luminosity function calculated from maximum likelihood estimation of the power-law exponent and truncation luminosity. The insets to the lower left of each panel indicate the distribution in slope values found with the bootstrapping method. While there is substantial overlap when three radial bins are used (lower panel), showing that randomly selected samples can yield somewhat different results, the distributions are quite separate when only two radial bins are used. This is reflected in the uncertainties. The vertical lines indicate the completeness limit; only these clouds are used to estimate the luminosity function parameters.
Current usage metrics show cumulative count of Article Views (full-text article views including HTML views, PDF and ePub downloads, according to the available data) and Abstracts Views on Vision4Press platform.
Data correspond to usage on the plateform after 2015. The current usage metrics is available 48-96 hours after online publication and is updated daily on week days.
Initial download of the metrics may take a while.