Fig. 5
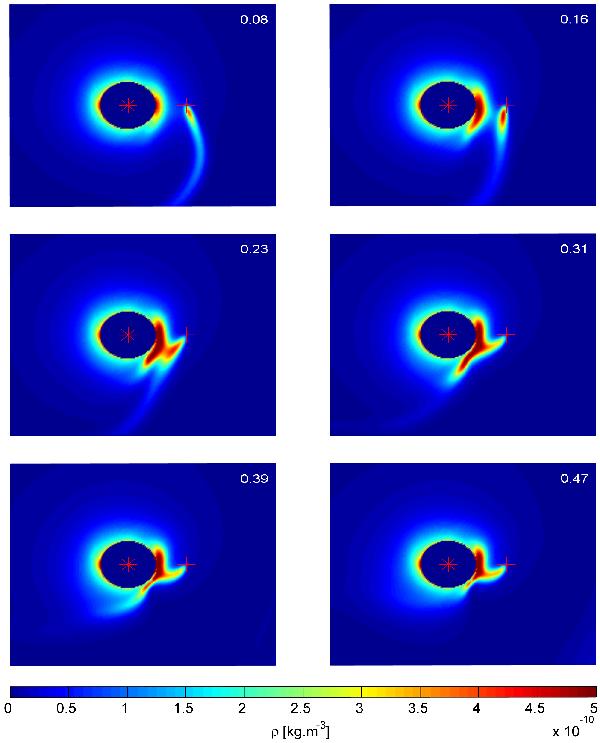
Evolution of the density distribution in the equatorial plane computed with the radiation hydrodynamic model after the line-driven force from the companion-facing hemisphere was artificially switched off. The initial state (the uppermost left panel) corresponds to the steady-state solution depicted in Fig. 4. The bottom right panel captures the new nearly steady-state solution. The white index in the upper right corner of the each panel indicates an evolutionary time expressed in the units of the orbital periods. The red cross and asterisk show the position of the black hole and the centre of the supergiant, resp.
Current usage metrics show cumulative count of Article Views (full-text article views including HTML views, PDF and ePub downloads, according to the available data) and Abstracts Views on Vision4Press platform.
Data correspond to usage on the plateform after 2015. The current usage metrics is available 48-96 hours after online publication and is updated daily on week days.
Initial download of the metrics may take a while.