Fig. A.4
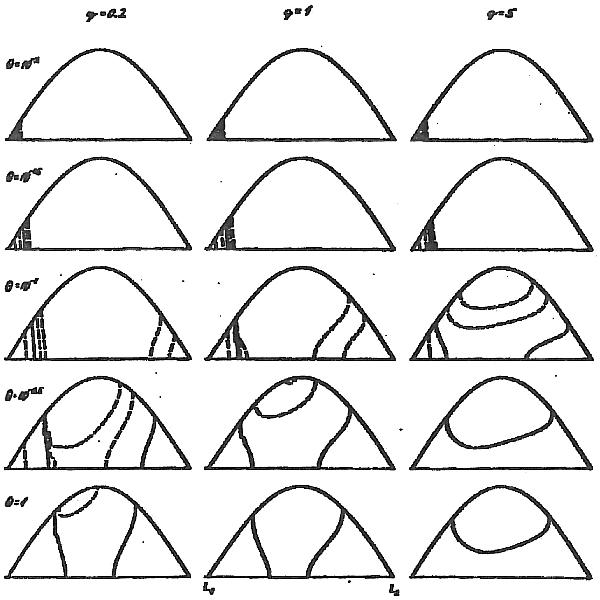
Angular distribution of wind strengths for several values of θ and q. Full lines mark the isocontours of the mean wind intensity (dashed lines show values for one and two orders higher and lower) in spherical coordinates with poles towards the L1 and L2 points. The latitude ϕ is drawn in a linear scale on the horizontal axis; the longitude λ measured from the intersection with the orbital plane scaled by cosϕ increases upward up to the rotational axis at the top of each drawing.
Current usage metrics show cumulative count of Article Views (full-text article views including HTML views, PDF and ePub downloads, according to the available data) and Abstracts Views on Vision4Press platform.
Data correspond to usage on the plateform after 2015. The current usage metrics is available 48-96 hours after online publication and is updated daily on week days.
Initial download of the metrics may take a while.