Fig. 3
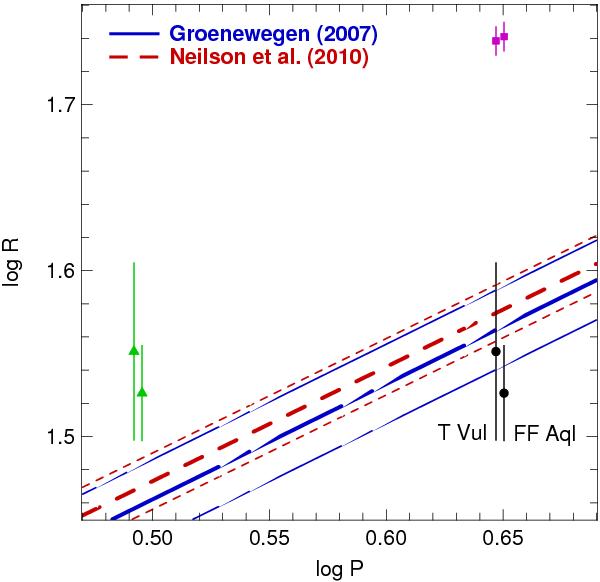
Period–radius relation for fundamental mode Cepheids. The colour curves represent the empirical and theoretical P–R relations from the literature. Each P–R intrinsic dispersion is plotted with a thinner curve, of the same colour and symbol. The dots are our estimated linear radii, the triangles are radii converted for first overtone pulsation, and the squares represent the theoretical first overtone radii.
Current usage metrics show cumulative count of Article Views (full-text article views including HTML views, PDF and ePub downloads, according to the available data) and Abstracts Views on Vision4Press platform.
Data correspond to usage on the plateform after 2015. The current usage metrics is available 48-96 hours after online publication and is updated daily on week days.
Initial download of the metrics may take a while.