Fig. 5
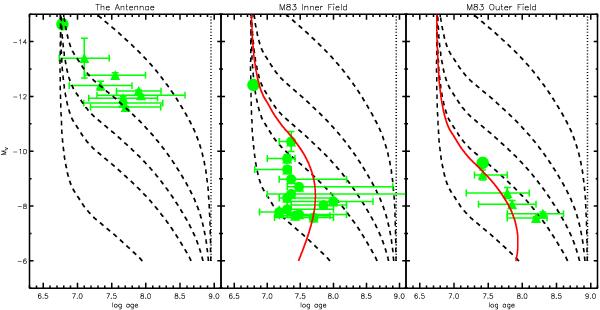
Age vs. MV for clusters in the Antennae (left panel – Whitmore et al. 2010), M 83 inner region (middle panel – Bastian et al. 2011) and M 83 outer region (right panel – Bastian et al. 2011). Only clusters with ages greater than 6 Myr were used. In all panels the brightest cluster in the sample is shown as a (green) filled circle. For the Antennae, the triangles represent the median of the age and MV of clusters in the rest of the catalogue (in bins of four clusters). For M 83, each bin contains 10 clusters. In the middle/right panels, the model corresponding to the best fit results of Bastian et al. (2012) are shown as solid (red) lines. They have been corrected the a Salpeter stellar IMF adopted by the Larsen (2009) models in M ⋆ . For the Antennae data, the error bars represent the standard deviation for each bin. For the M 83 data, the error bars represent the region where 60% of the data in that bin lie. We note that the models also show such scatter, i.e. only the median of the models is shown.
Current usage metrics show cumulative count of Article Views (full-text article views including HTML views, PDF and ePub downloads, according to the available data) and Abstracts Views on Vision4Press platform.
Data correspond to usage on the plateform after 2015. The current usage metrics is available 48-96 hours after online publication and is updated daily on week days.
Initial download of the metrics may take a while.