Fig. 4
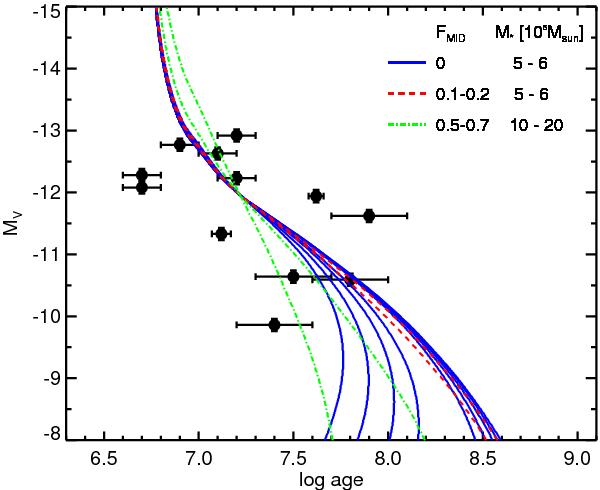
The observed age vs. MV relation along with the maximum likelihood models from Sect. 3.2. The solid (blue curves) represent models that have FMID = 0, and from left to right have t4 values ranging from 100 Myr (left) to 10 Gyr (right). All these models have M ⋆ values between 5 and 6 × 10⁵ M⊙. The dashed (red) lines have similar M ⋆ values, but no mass dependent disruption and a small amount of mass independent disruption. The dash-dotted (green) lines also represent models with a truncation mass ( ≳ 106M⊙) but have higher mass independent disruption rates.
Current usage metrics show cumulative count of Article Views (full-text article views including HTML views, PDF and ePub downloads, according to the available data) and Abstracts Views on Vision4Press platform.
Data correspond to usage on the plateform after 2015. The current usage metrics is available 48-96 hours after online publication and is updated daily on week days.
Initial download of the metrics may take a while.