Fig. 3
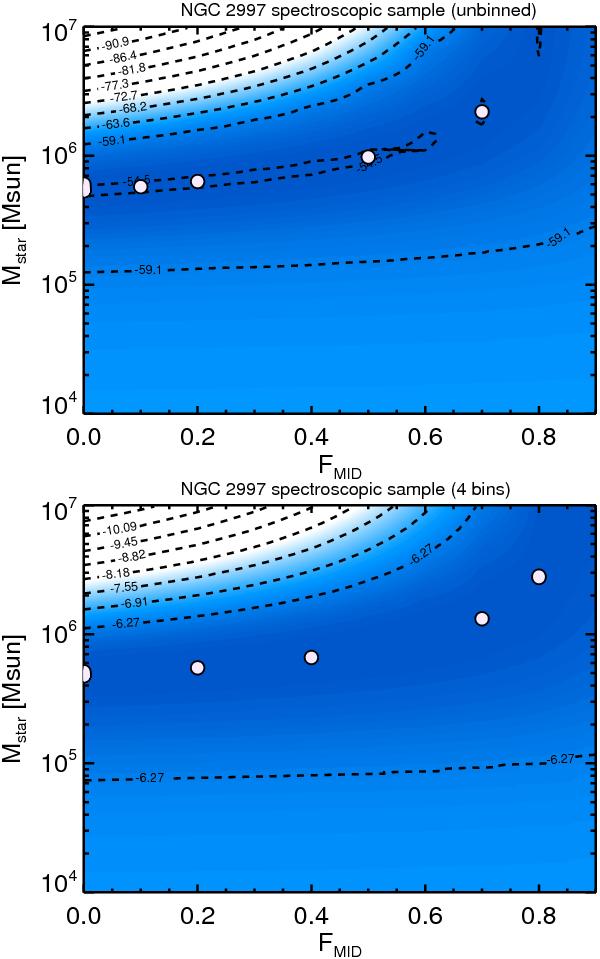
Results from the two dimensional statistical analysis (i.e., adopting no mass dependent disruption, and determining the likelihood for the models only varying M ⋆ and FMID ). The shaded region/contour lines denote the logarithm of the likelihood of the model for the combination of M ⋆ and FMID , and the filled (white) points denote the maximum likelihood models. Top: the analysis carried out on the unbinned dataset. Bottom: the same analysis, but now carried out on the binned dataset (four bins, each with the mean age/flux of three clusters). The white points from the upper panel denote models that are shown in Fig. 4.
Current usage metrics show cumulative count of Article Views (full-text article views including HTML views, PDF and ePub downloads, according to the available data) and Abstracts Views on Vision4Press platform.
Data correspond to usage on the plateform after 2015. The current usage metrics is available 48-96 hours after online publication and is updated daily on week days.
Initial download of the metrics may take a while.