Fig. 2
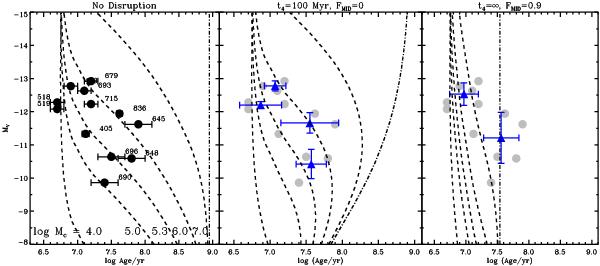
Age vs. MV for the twelve clusters in the present study. In each panel, we also show the expectations of the median MV , for a given age, following the results of Larsen (2009). The model disruption parameters are given at the top of each panel, where t4 is the disruption timescale of a 104 M⊙ cluster in the mass dependent cluster disruption scenario, and FMID is the fraction of clusters destroyed every decade in age. The dashed lines represent models with different values of the Schechter truncation mass, and the dashed-dot lines in each panel represents the case without truncation (i.e., a pure power-law). In the middle and right panels, the original data are shown in grey, while the binned data (the mean in flux and age, with the error bars representing the standard deviation) are shown as solid (blue) triangles. Two different bin sizes are shown.
Current usage metrics show cumulative count of Article Views (full-text article views including HTML views, PDF and ePub downloads, according to the available data) and Abstracts Views on Vision4Press platform.
Data correspond to usage on the plateform after 2015. The current usage metrics is available 48-96 hours after online publication and is updated daily on week days.
Initial download of the metrics may take a while.