Free Access
Fig. C.7
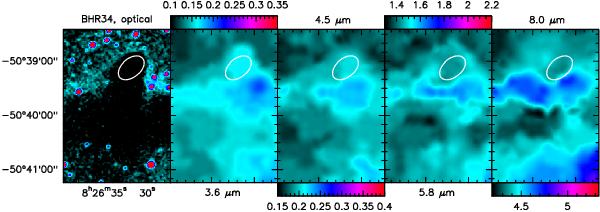
Zoom images of BHR34 extended emission in IRAC data (computed with a background estimation function). Coreshine is possibly seen also below the infrared horizontal bar, but is mixed with PAH emission and therefore difficult to establish. Same as Fig. B.2.
Current usage metrics show cumulative count of Article Views (full-text article views including HTML views, PDF and ePub downloads, according to the available data) and Abstracts Views on Vision4Press platform.
Data correspond to usage on the plateform after 2015. The current usage metrics is available 48-96 hours after online publication and is updated daily on week days.
Initial download of the metrics may take a while.