Fig. C.4
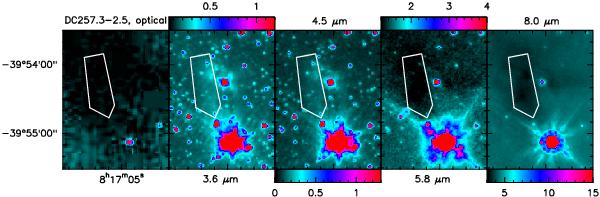
Zoom images of DC257.3-2.5. The polygon traces the coreshine emission region. This emission could benefit from the presence of the (probable) protostar situated on its right or of the IRAS source at the bottom, though the link of the IRAS source with the cloud has not been checked yet and is possibly a chance alignment. There is also possibly some coreshine on the righthand side of the (proto)star but it is highly uncertain. Same as Fig. B.2.
Current usage metrics show cumulative count of Article Views (full-text article views including HTML views, PDF and ePub downloads, according to the available data) and Abstracts Views on Vision4Press platform.
Data correspond to usage on the plateform after 2015. The current usage metrics is available 48-96 hours after online publication and is updated daily on week days.
Initial download of the metrics may take a while.