Free Access
Fig. C.3
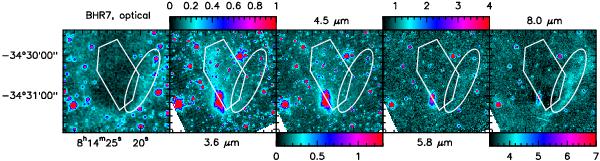
Zoom images of BHR7. The ellipse traces the PAH emission region, while the polygone traces the coreshine emission region. This emission seems to benefit from the presence of the protostar extended emission. Same as Fig. B.2.
Current usage metrics show cumulative count of Article Views (full-text article views including HTML views, PDF and ePub downloads, according to the available data) and Abstracts Views on Vision4Press platform.
Data correspond to usage on the plateform after 2015. The current usage metrics is available 48-96 hours after online publication and is updated daily on week days.
Initial download of the metrics may take a while.