Fig. 3
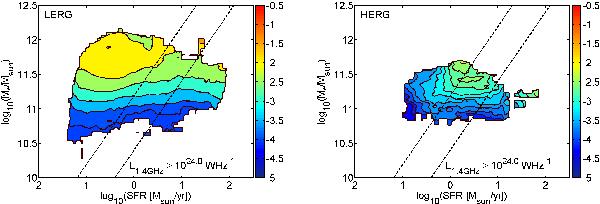
This contour plot shows the fraction of galaxies hosting a RL AGN in the stellar mass versus star formation rate plane. The value of  for low-excitation (left panel) and high-excitation (right panel) radio galaxies is given by color gradients for which the legend is found in the colorbars on the right. Only radio-loud AGN with a L1.4 GHz ≥ 1024.0 W Hz-1 were considered in the determination of
  . As the specific star formation rate (SFR/M∗) is broadly correlated with the Dn4000 value of a galaxy, each panel contains 2 diagonals, which are a guide to the eye on where the red, green and blue galaxy population are located.
Current usage metrics show cumulative count of Article Views (full-text article views including HTML views, PDF and ePub downloads, according to the available data) and Abstracts Views on Vision4Press platform.
Data correspond to usage on the plateform after 2015. The current usage metrics is available 48-96 hours after online publication and is updated daily on week days.
Initial download of the metrics may take a while.