Fig. 1
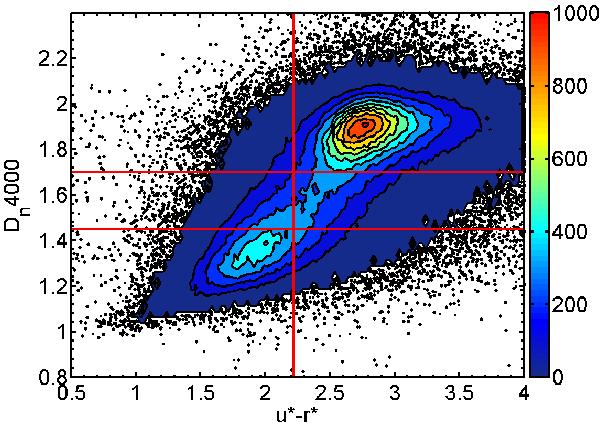
A contour plot showing the distribution of galaxies with a mass 1010.25 M⊙ ≤ M∗ ≤ 1012.0 M⊙ within the u∗ − r∗ vs. Dn4000 plane. The colorbar on the right indicates the number of galaxies per bin of width 0.025 in both u∗ − r∗ and Dn4000. If the number of galaxies per bin is less than 5, these galaxies are shown as black dots instead. The vertical red line indicates the optimum separation in the Petrosian color, u∗ − r∗ = 2.22, proposed by Strateva et al. (2001). Although this does indeed separate galaxies of the blue cloud and red sequence, the separation between the two populations is more pronounced in Dn4000. Therefore the horizontal separation lines Dn4000 = 1.45 and Dn4000 = 1.7 are adopted in this research. Galaxies between these two values are classified as green.
Current usage metrics show cumulative count of Article Views (full-text article views including HTML views, PDF and ePub downloads, according to the available data) and Abstracts Views on Vision4Press platform.
Data correspond to usage on the plateform after 2015. The current usage metrics is available 48-96 hours after online publication and is updated daily on week days.
Initial download of the metrics may take a while.