Fig. 2
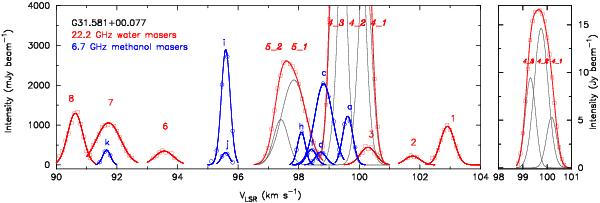
Individual component spectra with Gaussian velocity profiles of 22.2 GHz water masers (red squares and lines) and 6.7 GHz methanol masers (blue circles and lines) towards G31.581 + 00.077 detected using the EVN in 2010 and 2007, respectively. The numbers and letters correspond to the cloud labels as given in Table 1 and Fig. 1. The grey lines show individual Gaussian profiles fitted to the blended features. The clouds with only two single spots are not marked to improve the clarity of the figure (i.e., clouds b, e, g).
Current usage metrics show cumulative count of Article Views (full-text article views including HTML views, PDF and ePub downloads, according to the available data) and Abstracts Views on Vision4Press platform.
Data correspond to usage on the plateform after 2015. The current usage metrics is available 48-96 hours after online publication and is updated daily on week days.
Initial download of the metrics may take a while.