Fig. 1
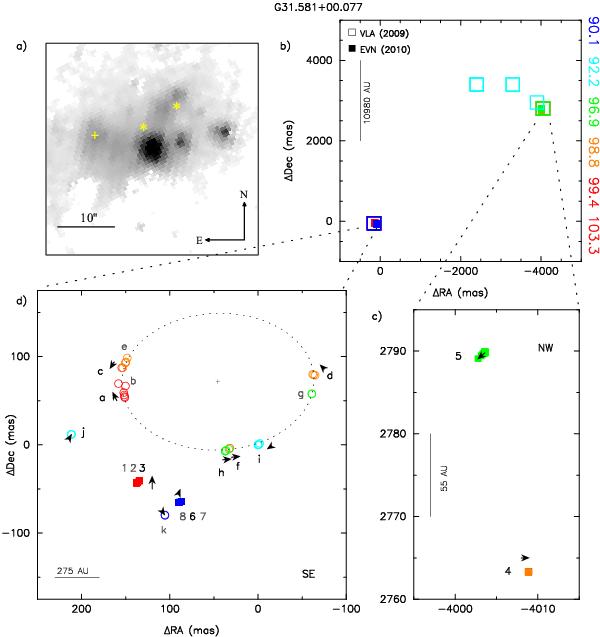
G31.581 + 00.077. a) Spitzer GLIMPSE 4.5–3.6 μm excess image overlaid with the water maser positions (yellow asterisks) from the EVN observation and H II region (yellow cross) detected by Bartkiewicz et al. (2009). b) Shows the distribution of water masers observed with the EVN (filled squares) from this paper and the VLA (open squares) from Bartkiewicz et al. (2011). The colours of the symbols relate to the LSR velocities as indicated on the right-hand side of the plot. The origin of the map is the position of the brightest 6.7 GHz methanol maser spot (Bartkiewicz et al. 2009) (see also Table 1). c) Shows an enlargement of the north-western (NW) water masers. d) Shows an enlargement of the south-eastern (SE) water masers together with the distribution of the 6.7 GHz methanol masers, marked by open circles, from Bartkiewicz et al. (2009). In c) and d), the arrows represent the velocity gradients (from blue- to red-shifted LSR velocities) detected within individual cloud. The black numbers and letters correspond to the clouds with internal velocity gradients, while the grey ones correspond to the clouds without internal velocity gradients (Table 3).
Current usage metrics show cumulative count of Article Views (full-text article views including HTML views, PDF and ePub downloads, according to the available data) and Abstracts Views on Vision4Press platform.
Data correspond to usage on the plateform after 2015. The current usage metrics is available 48-96 hours after online publication and is updated daily on week days.
Initial download of the metrics may take a while.