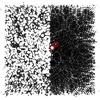
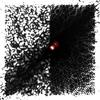
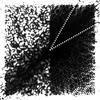
Fig. 2
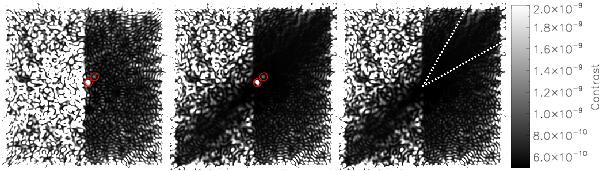
Central part of images without detection noise produced by the simulation, after the coronagraph (left) and after the speckle calibration by the self-coherent camera (middle and right). The image size is ~64 × 64 (λ/D)2 (λ = 0.675 μm). In the two left images, there are two jovian planets of contrasts ~10-8 and ~10-9 (red circles). In the right image, we indicate the calculation area of the profiles shown in Sect. 3 with a white dotted line. The intensity scales are linear and identical.
Current usage metrics show cumulative count of Article Views (full-text article views including HTML views, PDF and ePub downloads, according to the available data) and Abstracts Views on Vision4Press platform.
Data correspond to usage on the plateform after 2015. The current usage metrics is available 48-96 hours after online publication and is updated daily on week days.
Initial download of the metrics may take a while.