| Issue |
A&A
Volume 541, May 2012
|
|
|---|---|---|
| Article Number | A114 | |
| Number of page(s) | 8 | |
| Section | Atomic, molecular, and nuclear data | |
| DOI | https://doi.org/10.1051/0004-6361/201218949 | |
| Published online | 10 May 2012 | |
Aminoacetonitrile characterization in astrophysical-like conditions
Aix-Marseille Université et CNRS, Laboratoire de Physique des Interactions Ioniques et Moléculaires, UMR 7345, Centre de St-Jérôme, case 252, Avenue Escadrille Normandie-Niémen, 13397 Marseille Cedex 20, France
e-mail: This email address is being protected from spambots. You need JavaScript enabled to view it.
Received: 2 February 2012
Accepted: 23 March 2012
Abstract
Context. Aminoacetonitrile (AAN) has been detected in 2008 in the hot core SgrB2. This molecule is of particular interest because it is a central molecule in the Strecker synthesis of amino acids. This molecule can be formed from methanimine (CH2NH), ammonia (NH3) and hydrogen cyanide (HCN) in astrophysical icy conditions. Nevertheless, few studies exist about its infrared (IR) identification or its astrophysical characterization.
Aims. We present in this study a characterization of the pure solid AAN and when it is diluted in water to study the influence of H2O on the main IR features of AAN. The reactivity with CO2 and its photoreactivity are also studied and the main products were characterized.
Methods. Fourier transformed infrared (FTIR) spectroscopy of AAN molecular ice was performed in the 10–300 K temperature range. We used temperature-programmed desorption coupled with mass spectrometry detection techniques to evaluate the desorption energy value. The influence of water was studied by quantitative FTIR spectroscopy and the main reaction and photochemical products were identified by FTIR spectroscopy.
Results. We determined that in our experimental conditions, the IR limit of AAN detection in the water ice is about 1 × 10¹⁶ molecule cm-2, which means that the AAN detection is almost impossible within the icy mantle of interstellar grains. The desorption energy of pure solid AAN is of 63.7 kJ mol-1 with ν0 to 1028 molecule cm-2 s-1, which implies that the presence of this molecule in the gas phase is only possible in hot cores. The glycine (Gly) formation from the AAN through the last step of the Strecker synthesis seems to be impossible in astrophysical-like conditions. Furthermore, AAN is photoresistant to vacuum ultra-violet radiation, which emphasizes the fact that AAN can be considered as a Gly reservoir molecule.
Key words: astrochemistry / ISM: molecules / dust, extinction / molecular processes / molecular data / methods: laboratory
© ESO, 2012
1. Introduction
Aminoacetonitrile (AAN) is a central molecule in the Strecker synthesis of Glycine (Gly) (Elsila et al. 2007). Aminoacetonitrile is then considered as one of the best ways to form amino acids in prebiotic environment and more especially in the Urey-Miller-type experiments (Miller 1953). The Strecker synthesis implies the reaction of NH3 with an aldehyde (formaldehyde for the Gly formation) in presence of hydrogen cyanide (HCN). The first step of this reaction is the formation of an aminoalcohol that is then dehydrated in imine. Those reactions are easily observed in liquid phase, but were recently confirmed in astrophysical-like conditions (Bossa et al. 2009b; Duvernay et al. 2010; Vinogradoff et al. 2011, 2012). This molecule can react with HCN and form aminoacetonitrile, yielding Gly by hydrolysis. In liquid phase, AAN can produce hydantoine and N-carbamoylaminoacid (CCA) following the Bucherer-Bergs reaction (Commeyras et al. 2004; de Marcellus et al. 2011). This CCA leads to amino acid polymerization in aqueous environments (Commeyras et al. 2004; Danger et al. 2006).
AAN is also of great interest because its detection in the gas phase of interstellar medium (ISM) was confirmed by Belloche et al. in 2008 (Belloche et al. 2008) in Sgr(B2), where the authors were able to derive a column density of 2.8 × 10¹⁶ molecule cm-2. For the ISM, aminoacetonitrile can be considered as a complex organic molecule, and the best hypothesis for its formation is onto icy grains (Requena-Torres et al. 2006). Then it can be released in the gaseous phase of the ISM through different processes (Burke & Brown 2010).
Dust particles in dense clouds are made by icy mantles that surround silicate cores. Ices are mainly composed of water (H2O) with other molecules such as carbone monoxide (CO), carbon dioxide (CO2), ammonia (NH3), and methanol (CH3OH) (Dartois 2005). The ISM is a harsh environment where dust is subjected to energetic processes such as thermal effects, high-energy particles and photons. According to this, different ways of aminoacetonitrile formation on the interstellar grains has been proposed (Fig. 1).
Photochemical pathways have been studied from acetonitrile and NH3 mixtures, which leads to low yields (Danger et al. 2011b). Thermal pathways from methanimine and HCN mixed with NH3 are more efficient, see Danger et al. (2011a). This study showed that the Strecker synthesis can occur in condensed phase in astrophysical-like conditions, until the aminoacetonitrile formation, as was predicted by theoretical works (Woon 2002; Koch et al. 2008). The last step of this synthesis is the AAN hydrolysis, which leads to glycine formation. This step seems to be inefficient in ISM-like conditions. Therefore, AAN is, at least, a reservoir molecule.
Bernstein et al. (2004a) have shown that AAN is also more resistant to ultraviolet (UV) and vacuum ultra-violet (VUV) lights than amino acids, with an approximate half-life in argon matrix of 1300 years under a typical UV flux for diffuse ISM, which emphasizes this role of reservoir molecule. Few studies characterize the AAN spectrally. In 2004, Bernstein et al. (2004b) published a rare gas matrix isolation study of AAN, showing that the more characteristic feature in infrared (IR), the νCN stretching mode, is almost undetectable. The consequence is that the upper-limit detection in the solid phase of the ISM should be really high.
In this contribution, we provide a full characterization of solid AAN in an astrophysical environment. First we give the full IR spectrum of condensed AAN. We also propose a mass spectrometry characterization of the AAN ice with an estimation of the desorption energy of solid AAN, obtained by temperature-programmed desorption (TPD). We mixed AAN in H2O at 20 K, forming an ice, and we studied the environment influence of water molecules on the characteristic νCN stretching mode, allowing us to derive an upper-limit detection of AAN in the interstellar ices. We then studied the reactivity of AAN with CO2 as well as its photoreactivity in the VUV range by characterizing the main photoproducts at low temperature.
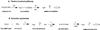 |
Fig. 1 Photochemical and thermal pathways for AAN formation in interstellar ices. |
2. Experimental
Pure (97%) aminoacetonitrile (NH2CH2CN) was provided by Sigma Aldrich, and CO2 (99.995%) by Air Liquide. Gas mixtures were prepared by standard manometric techniques in a vacuum line under 10-3 mbar and deposited on a gold-platted surface cooled at 20 K by a 21 CTI cold head in a cryostat. The temperature was controlled by a Lakeshore model 331 temperature controller, and generally a ramp of 5 K.min-1 was used. Our diagnosis was made with FTIR spectroscopy used in reflection mode, all spectra were recorded between 4000 and 600 cm-1 with a 1 cm-1 resolution using a NICOLET MAGNA 750 spectrometer equipped with a MCT (Mercury-Cadmium-Telluride) detector. One hundred interferrograms were recorded for all reference spectra and only 20 accumulations were made each 10 K during a warming-up. The VUV irradiation source was a H2 flux lamp irradiating in a range from 120 nm until a continuum in the visible through a MgF2 window directly connected to our cryostat. The VUV flux was 2 × 10¹⁵ photons cm-2 s-1, which is 1010 times higher than the flux of cosmic-ray-induced UV photons existing in the dense molecular clouds of the ISM (Prasad & Tarafdar 1983). The mass spectra were recorded with an RGA (residual gas analyzer) quadrupole mass spectrometer (MKS Microvision-IP Plus) when the sample desorbed during a temperature ramp. The ionization source was a 70 eV electronic impact and the detector was an electron amplifier. All mass spectra were recorded in full scan mode or a SIM mode between m/z 1 and 80 amu. All samples were made in a pyrex vacuum line, each liquid (aminoacetonitrile and water) was distilled directly on the line after a few freeze-thaw cycles. Gas samples were directly used as supplied.
3. Results
3.1. IR spectroscopy characterization of aminoacetonitrile
Figure 2 displays the aminoacetonitrile IR spectrum deposited at 130 K to avoid any residual CO2 contamination, then recorded at 20 K. Indeed, aminoacetonitrile and CO2 thermally react in ice for temperatures higher than 130 K, leading to the formation of a carbamate (see Sect. 3.4). Table 1 summarizes the main wavenumbers. Basically, the main bands are the NH stretching and a torsion mode at 923 cm-1. The most characteristic band of the aminoacetonitrile, which is not the most intense of the spectrum, is the feature at 2237 cm-1, a typical position for a νCN mode. The relative intensity of this mode is quite low. Bernstein et al. (2004b) found that this mode was almost undetectable in matrix isolation experiment. In the solid phase, this mode is observable. Even if its intensity is quite low compared to the other bands, this nitrile stretching mode is used as a probe of AAN presence. Indeed, when AAN is mixed with other compounds (such as H2O, NH3, for examples) the other AAN modes are in overlapped zones. Moreover, this spectrum area (2000–2300 cm-1) is generally clear and can be used for the aminoacetonitrile identification (Danger et al. 2011a). Since temperature can influence IR profiles, the AAN warming was investigated. During an annealing experiment with a 5 K/min temperature ramp, no significant modification were observed in band positions. A sharpening appears after 160 K due to its crystallization. The nitrile band is shifted toward the high wavenumber of 2 cm-1 from 160 K, and the shape of the IR profile is also sharpened from this temperature. After 190 K, the aminoacetonitrile begins to desorb, and at 210 K no more compound is left on the surface.
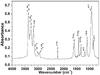 |
Fig. 2 FTIR spectrum of pure aminoacetonitrile deposited at 130 K and then recorded at 20 K. |
IR spectra for pure NH2CH2CN at 25 K and after 240 min of irradiation at 25 K in our laboratory conditions.
3.2. Mass spectrometry study and desorption of pure NH2CH2CN in the multilayer regime
Figure 3 displays the mass spectrum obtained when aminoacetonitrile is desorbing around 200 K. The main fragments are summarized in Table 2, and the most characteristic ions are m/z 56 amu, aminoacetonitrile molecular ion, and the fragments m/z 55 and 53 amu corresponding to the loss of successive H atoms.
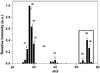 |
Fig. 3 Mass spectrum of AAN recorded at 204 K during an annealing ramp of 2 K min-1. |
Main detected fragments during the AAN desorption by mass spectrometry.
Temperature-programed desorption experiments were performed to determine the activation desorption energy of AAN. Pure NH2CH2CN was deposited at 130 K, then cooled down at 20 K on the gold surface to obtain a multilayer sample of NH2CH2CN. Using the column density derived from the IR band at 2237 cm-1, we can estimate that the sample thickness is of approximately 800 monolayers. The solid NH2CH2CN sample was submitted to a temperature ramp. The TPD curve of NH2CH2CN given by the QMS (quadrupole mass spectrometer) signal exhibits a zeroth-order thermal desorption pattern, characteristic of bulk desorption in the multilayer regime, as shown in Fig. 4. Depositing five different amounts of NH2CH2CN give TPD curves with similar rising edge and different sharp falling edges.
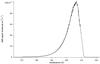 |
Fig. 4 Quadruple mass spectrometer temperature-programmed desorption curve (m/z 56) of a pure NH2CH2CN multilayered sample with a 2 K/min temperature ramp rate. The desorption rate was normalized to one-monolayer (1015 molecule cm-2) (dashed line). The solid line is the result of the fit by the zeroth-order Polanyi-Wigner equation. |
The QMS signal is proportional to the instantaneous desorption rate. The proportionality coefficient is related to the collection efficiency and the ionization yield of the QMS. The desorption rate ϕ is normalized to a one monolayer coverage (1015 molecule cm-2) and to a 1 cm2 surface by dividing by the integral of the QMS curve and multiplying by 1015 molec cm-2 × 1 cm2. We fitted the rising edge of the normalized desorption rate ϕ curve to the zeroth-order of the Polanyi-Wigner equation, as a function of temperature T (Redhead 1962; Carter 1962): 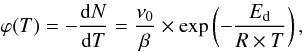 (1)where ν0 is the zeroth-order pre-exponential factor of the rate constant, Ed is the desorption energy, R is the ideal gas constant, and β the temperature ramp rate, β ranging from 1 K min-1 to 8 K min-1 in our case. Since ν0 and Ed are correlated, we obtain a non physically relevant Ed by adjusting both ν0 and Ed on the TPD curve. Instead of that we chose to fix ν0 to a physically relevant value to be able to compare desorption energies of different molecules. Therefore we fixed ν0 to 1028 molecule cm-2 s-1 using a typical 1015 molecule cm-2 surface density of sites and a typical 1013 s-1 adsorbate-surface oscillation frequency. Both values can change by a small factor according to the nature of the adsorbed molecule and of the surface. The surface coverage is related to the average distance between two adsorption sites, and the oscillation frequency to the nature of the interaction between the surface and the adsorbate. The mistake on ν0 is directly correlated to the derived value of Ed.
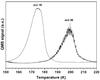 |
Fig. 5 Temperature desorption profile of m/z 18 (H2O) and 56 (AAN) coming from AAN/H2O (1:4) mixture. The ice was warmed with a 5 K min-1 heating rate. |
Fitting the rising edge of the TPD curve with only Ed as a free parameter and fixing ν0 = 1028 ± 0 molecule cm-2 s-1, we obtain Ed = 63.7 ± 0.8 kJ mol-1 for the multilayer desorption of pure NH2CH2CN. The ± 0.8 kJ mol-1 uncertainty on Ed is the dispersion of Ed from five different TPD experiments. The uncertainty on the fit itself or on choosing different portion of the rising edge of the TPD curve gives an approximate 0.02 kJ mol-1 uncertainty on Ed. Varying the oscillation frequency from 1012 s-1 to 1014 s-1 gives Ed = 64.5 ± 4 kJ mol-1. So we choose to use the couple of solution ν0 = 1028 ± 0 molecule cm-2 s-1, Ed = 63.7 ± 0.8 kJ mol-1 to express the zeroth-order desorption rate of multilayer NH2CH2CN.
3.3. Aminoacetonitrile in water ice
In astrophysical ices, the main component is water (Greenberg 2002), allowing a spectral window for AAN detection around 2200 cm-1 relative to the νCN mode. Therefore, in this section we estimate the influence of water on the IR profile of the nitrile mode. For this study, different ratios of (AAN/H2O) mixture were deposited with ranges varying from 2:1 to 1:100. Firstly, a mixture of AAN/H2O with 1:4 ratio was deposited, and its thermal evolution was monitored by IR spectroscopy and mass spectrometry. Figure 5 displays the corresponding mass spectrum. Two mass peaks are observed, corresponding to water and AAN desorption characterized by the ions m/z 18 and m/z 56 amu, respectively. These desorptions are independent, and correspond to the mass signal of each isolated molecule. It means that in this proportion, the water does not carry away the AAN.
Nevertheless, when the H2O/AAN ratio was increased, AAN molecules were increasingly surrounded by water molecules. For an initial ice mixture containing AAN/H2O with a ratio 1/100, the AAN desorbs at 180 K (Fig. 6, m/z 56 amu), which is the water desorption temperature (Fig. 6, m/z 18 amu). Therefore at high dilution the energy desorption of AAN is equivalent to that of the major ice compound, that is in our case the water.
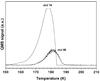 |
Fig. 6 Temperature desorption profile of m/z 18 (H2O) and 56 (AAN) coming from AAN/H2O mixture (1:100). The ice was warmed with a 5 K min-1 heating rate. |
We also studied the influence of water on the AAN IR spectra, and more especially on the nitrile mode, since this mode is considered as a probe for AAN identification. Figure 7 displays the IR spectrum of an AAN/H2O ice mixture within a 1:3 ratio deposited at 50 K. The IR spectrum is largely dominated by the strong band related to the OH stretching mode of water, while the CN stretching mode of AAN located at 2253 cm-1 is almost undectable and shifted from the value observed in the pure solid (2237 cm-1). Changes are also observed during the ice warming. This mode is shifted at 170 K, toward lower wavenumbers at 2240 cm-1 (Fig. 8B). At 180 K, when water begins to massively desorb, the nitrile mode is shifted at 2237 cm-1 corresponding to a pure AAN ice (Figs. 8A, and C).
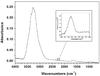 |
Fig. 7 FTIR spectrum of an AAN/H2O ice mixture (1:3) deposited and recorded at 50 K. |
Moreover, in the same figure we observed that the intensity of this mode is growing during the water desorption. The main change is observed between 170 K and 180 K. At this mixing ratio (AAN/H2O 1:3), AAN and water desorption are independent (Fig. 5), which suggests that the amount of AAN is sensibly the same on the substrate at 170 K (before the water desorption) and at 180 K (after the water desorption). Therefore, considering that the absorbance (Av) is proportional to the column density N (molec cm -2) and to the band strength  of the νCN mode (cm molecule-1), the water molecule effects on the nitrile vibration can be estimated using the relation
  . Fixing the integration range between 2280 and 2225 cm-1, and reporting the ratio between the areas at 170 and 180 K, the following correspondence is obtained:
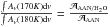 . To our knowledge, the nitrile band strength of the AAN has not been evaluated so far, therefore in first approximation, the band strength of the acetonitrile (ACN) was used (
 cm molecule-1). Then, by interaction with water molecules for this mode, we obtained the value
 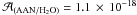 cm molecule-1. Therefore, the presence of water in AAN environment has a strong influence on the band strength, since it decreased by half. In our experimental conditions, using IR spectroscopy, we also estimated the limit of AAN dectection. The noise was estimated from the base line of our IR spectra in a zone where no main bands are observed (between 1900 and 2000 cm-1). Assuming that the nitrile band located at 2240 cm-1 cannot be detected for a signal-to-noise ratio (S/N) lower than 3, we estimated that AAN cannot be detected for a column density lower than 1 × 10¹⁶ molecule cm-2 (our typical IR spectra are averaged over 100 scans).
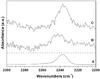 |
Fig. 8 AAN/H2O (1:3) IR spectrum in the νCN region at (A) pure AAN at 130 K, (B) 170 K, and (C) 180 K. |
3.4. Reactivity of aminoacetonitrile with CO2
The carbon dioxide CO2 is a molecule that is suspected to have abundances (Ehrenfreund & Charnley 2000; Pontoppidan et al. 2008) in interstellar ices between 7 and 25%. Moreover, it has been shown recently that CO2 could react thermally into ices with methylamine to form the methylammonium methylcarbamate, which can be then isomerized into glycinate salt, the anionic form of Gly (Bossa et al. 2008b, 2009a, 2010). This way of Gly formation is an alternative way to the Strecker synthesis for the amino acid formation (Danger et al. 2011a). Since carbon dioxide can react with amine, the AAN reactivity was studied in its presence.
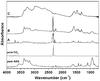 |
Fig. 9 IR spectra of pure aminoacetonitrile at 50 K, pure CO2 at 25 K, (A) AAN/CO2 1:3 at 50 K, and after the warming of ice at (B) 130 K, and (C) 240 K. |
IR absorption bands and assignments of the carbamate NCCH2NHCOO−NCCH2NH formed from the warming of a binary ice mixture NH2CH2CN:CO2=1:3.
Figure 9 displays IR spectra of AAN diluted in carbon dioxide ice at various temperatures. The binary ice obtained at 50 K (Fig. 9A) is the superposition of pure CO2, and pure AAN (Fig. 9) spectra, indicating that no reaction occurs at 50 K. When the temperature was increased, new bands appear on the spectrum recorded at 130 K (Fig. 9B), while at the same time, the characteristic bands of AAN and CO2 decreased, which indicates a thermal reaction between them. Finally at 240 K, since the remaining starting materials (AAN and CO2) have desorbed, we observe the IR spectrum of the pure product (Fig. 9C). The observed IR bands are very close to those already observed for CO2 reactivity with amines (Bossa et al. 2008a,b), and are listed in Table 3. Those bands are characteristic of the corresponding carbamate (NC-CH2-NH-COO−) and its counter-ion, which is the ammonium salt of AAN (NC-CH2-NH). Finally, the carbamate fully sublimates in our experimental conditions at temperature higher than 270 K (Fig. 10). The reaction between AAN and CO2 can be summarized by the following equation:  (2)The carbamate formation is also supported by a mass spectrometry experiment showing first the desorption of the remaining starting materials: CO2 at 100 K followed by the AAN at 200 K. At 260 K, we then observe three masses m/z 44, 55, 56 amu (Fig. 9) when the carbamate starts to sublimate. Those masses are characteristic of AAN (m/z 56 and 55 amu) and CO2 (m/z 44 amu), and can be easily explained by the decomposition of the carbamate in the gas phase, into CO2 and AAN.
We also investigated the influence of water on the warming of this ice mixture. We diluted AAN/CO2 in water to obtain an ice mixture AAN/CO2/H2O within a 1:3:3 molecular ratio. After thermal treatment at 240 K, the same type of residue is observed (Fig. 11) for both AAN/CO2 (Fig. 11A) and AAN/CO2/H2O (Fig. 11B). Slight differences are observed, which correspond to the balance between neutral carbamic acid (NCCH2NHCOOH) characterized by a band located at 1689 cm-1 and ionic carbamate (NCCH2-NHCOO−) (Fig. 11). In water, it seems that more carbamic acid is formed. These experiments generalize the formation of carbamate derivative through the possible formation and reaction of amines and CO2 at low temperature in interstellar ice analogues.
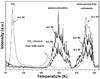 |
Fig. 10 Mass spectrum obtained during the warming of an initial ice containing AAN/CO2 1:3. |
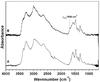 |
Fig. 11 IR spectra obtained at 240 K after the warming of an initial ice containing (A) AAN/CO2 1:3, and (B) AAN/CO2/H2O 1:3:3. |
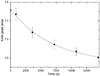 |
Fig. 12 Diminishing area of the IR feature of AAN (2237 cm-1) with increasing the VUV exposure. The decrease of AAN is fitted against an exponential decay. |
3.5. VUV irradiation
Since VUV irradiations can occur in various astrophysical environments, we also studied the photoreactivity of AAN. For this study, pure AAN was deposited in the cryostat on the gold surface and was irradiated. In the laboratory time scale, this VUV irradiation of AAN is not very efficient and the photoproducts bands that are growing have low intensities. Figure 12 shows the decay of the AAN nitrile band at 2237 cm-1 integrated between 2280 and 2225 cm-1 using the band strength of standard nitrile containing molecules (acetonitrile: cm molecule-1). After 4 h of irradiation, 40% of AAN was consumed, as shown in Fig. 12. Its disappearance was fitted by a first-order decay (simple exponential: y = 0.587 × exp( − 1.446 × 10⁻⁴ × t) + 0.838), allowing us to derive a photo-dissociation cross section of 7.2 × 10⁻²⁰ photon-1 cm2, which agrees with the value of 8.8 × 10⁻²⁰ photon-1 cm2 reported by Bernstein et al. (2004a). This cross-section is one order of magnitude lower than the typical values reported for typical molecules observed in the interstellar ices (CH3OH, CO2, NH3), which supports the hypothesis that AAN can survive in presolar environment and so be incorporated into a newly forming planetary system. Thus the photochemical stability of AAN, combined with its capacity to form Gly in liquid water, make AAN a logical precursors to Gly in meteorites (Bernstein et al. 2004a).
Figure 13 displays the difference spectrum of two spectra obtained before and after 258 min of VUV irradiation. The most striking feature is growing in the 2087–2060 cm-1 zone, and according to its width as well as its structure, this band should be related to molecules bearing a CN moiety. The bands, which are growing at 2222, 1604, 1379 and 1218 cm-1, correspond to the iminoacetonitrile, HN=CH=CN (Fig. 13) (Evans et al. 1991). These assignments are also confirmed by the presence of bands at 2141 and 2063 cm-1 caused by the photodecomposition of iminoacetonitrile in cyanogen, NC-CN (Blanch & McCluskey 1995). Indeed, this product is due to the dehydrogenation of the iminoacetonitrile, which is a common process for the VUV irradiation (Bossa et al. 2012).
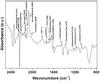 |
Fig. 13 Difference of IR spectra obtained at 25 K before and after 258 min of VUV irradiation containing pure AAN. |
The bands at 1637 and 1452 cm-1 are caused by the formation of the methanimine, CH2=NH (Fig. 13) (Danger et al. 2011a; Theule et al. 2011). This product is probably formed by a cleavage of the C–C bond of the iminoacetonitrile forming the radical HN=CH•, which can react with an H radical, forming the methanimine. The dehydrogenation product of this latter molecule is the HCN formation, which is not directly detected in our experiments. But the CN− and its counter-ion NH are detected with the bands at 2063 (CN−), 1658 cm-1 (NH), which are typical for the acid-base reaction induced by HCN (Danger et al. 2011a; Moore & Hudson 2003; Gerakines et al. 2004; Clutter & Thompson 1969). When the resulting irradiated ice is warmed, a nitrile band at 2161 cm-1 appears (Fig. 12B). This band is the signature of an iminoacetonitrile polymerization (Lorencak et al. 1986; Khare et al. 1994; Liebman et al. 1995). The different degradation pathways of aminoacetonitrile are summarized in Fig. 14.
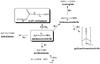 |
Fig. 14 Representation of the different possible pathways of degradation of AAN and its carbamate under VUV irradiations. |
4. Astrophysical implication
AAN can be considered as a glycine precursor in astrophysical environments because of its central place in the Strecker synthesis. Recently it has been shown that the first steps of this synthesis could take place in interstellar environment (Danger et al. 2011a), and especially in the icy grains around 130 K. These icy grains have to be considered as important chemical reactors for the molecular complexity emergence in the ISM (Herbst & van Dishoeck 2009). Simple molecules can indeed be formed in the gas phase, and condensed onto these grains followed by reactions like hydrogenation (Theule et al. 2011), irradiations or thermal reactivity, leading to more complex molecules .
We have shown in this contribution that in our experimental conditions, in a water-dominated ice, the upper limit of AAN detection is 1 × 10¹⁶ molecule cm-2 using the CN stretching mode located around 2250 cm-1. The band strength of this mode is very low and unfortunately even lower (divided by a factor 2) when AAN is diluted in water. This implies that the aminoacetonitrile detection in the icy grains is far from obvious, since the water is the most abundant compound of the ice, and that only few amounts of aminoacetonitrile are certainly present in the ice. To illustrate the difficulty of detecting AAN by means of IR spectroscopy in ice, we estimated the upper limit of detection of AAN in various astrophysical environments, considering that the S/N of ISO satellite is 40 times lower than ours (Table 4). For these environments, AAN would be detectable only for an AAN/H2O ratio higher than 6%. No one expects AAN to be in such high concentration in interstellar ices, which rules out the possibility of detection in ice of AAN in the mid-IR region (MIR). However, far-IR spectroscopy (FIR) may be an interesting alternative way to characterize AAN in ice.
Column densities and upper limit of AAN detection in various astrophysical environments.
However, in specific zones, such as in protostellar environments (Ceccarelli 2008) or hot cores, exchanges can occur between the solid phase of these icy grains and the gas phase, leading to a release of complex molecules in the gas phase allowing their detection. This is an explanation of the AAN detection in the gas phase of SgrB2 (Belloche et al. 2008), where a column density of 2.8 × 10¹⁶ molecule cm-2 has been derived. In this study, we also measured the activation desorption energy of AAN around 63.7 kJ mol-1 for the pure solid. This value would indicate that this molecule is more refractory than water (48 kJ mol-1, Fraser et al. 2001) and should be released in the gas phase at a temperature higher than water. However, when AAN is diluted in water ice, a large amount of AAN is driven away when the water starts to sublime. Consequently, in interstellar ices, AAN could be released in the gas phase at lower temperature in a hot environment such as hot cores, when the water ice sublimes. This hypothesis is supported by the fact that AAN is detected in the gas phase at 100 K in SgrB2 (Belloche et al. 2008), which corresponds to the snow-line temperature in the ISM. This result agrees with an AAN formation on the interstellar grains at low temperature and its release in the gas phase when water sublimes around 100 K in the ISM.
From an astrobiological point of view, aminoacetonitrile has to be considered as a reservoir of glycine molecules. Indeed, as shown with the experiment using AAN:H2O mixtures, the Strecker synthesis could not continue until the amino acid formation as was already predicted by theoretical calculations (Rimola et al. 2010). Furthermore, because we have observed that formic acid can activate imine reactivity (Vinogradoff et al. 2012), we tested the heating of an ice mixture containing AAN/H2O/HCOOH. We observed no glycinamide or glycine formation, but only the salt formation. Therefore, it seems that the last step of the Strecker synthesis, the glycine formation, is not effective in interstellar environments. In consequence, this molecule appears to be a reservoir molecule of glycine in these environments.
These icy grains containing organic matter such as aminoacetonitrile were able to continue to evolve, because they could be incorporated in the protoplanetary disk formation phase, leading to the formation of comets and asteroids. Inside these small interplanetary bodies, they are protected from additional degradations. However, in some asteroids, these organic molecules may have been subjected to an aqueous phase (Abramov & Mojzsis 2011; Herd et al. 2011), which led to a hydrolysis process, and therefore to the glycine in the case of aminoacetonitrile. In the end, comets and asteroids were able to deliver this complex organic matter to telluric planets, where it could undergo chemical processes in specific environments, such as in prebiotic environments, meaning that the aminoacetonitrile formed in astrophysical environments may be considered as a prebiotic molecule once it is present in these specific environments, as on the primitive Earth.
5. Conclusion
We characterized in astrophysical-like conditions AAN, which is a central molecule in the Strecker synthesis yielding amino acids. This study demonstrated that if AAN exists in dusty grains, it should be undetectable in the solid phase by actual means of observation in the MIR region. Indeed, the main band at 2237 cm-1 is the only one that can be used as a probe. It is inconvenient that this band is very sensible to the water environment. In consequence, another part of the IR region should be studied, such as FIR region. Therefore, this molecule has to be in the gas phase to be observed, as Belloche et al. have done in SgrB2 (Belloche et al. 2008). Moreover, we demonstrated that the desorption energy is quite significant, which means that this molecule has to be in a hot region to be released to the gaseous phase. In astrophysical environments, AAN has to be considered as a reservoir molecule of glycine, but it seems almost impossible for this molecule to yield Gly in those environments. However, in a planetary system, AAN can lead to Gly formation through hydrolysis processes inside asteroids or at the surface of telluric planets.
Acknowledgments
This work has been founded by the French national program Physique Chimie du Milieu (PCMI), the French interdisciplinary program Evolution des Planètes et Origine de la Vie (EPOV) and the Centre National d’Études Spatiales (CNES).
References
- Abramov, O., & Mojzsis, S. J. 2011, Icarus, 213, 273 [NASA ADS] [CrossRef] [Google Scholar]
- Belloche, A., Menten, K. M., Comito, C., et al. 2008, A&A, 482, 179 [NASA ADS] [CrossRef] [EDP Sciences] [Google Scholar]
- Bernstein, M. P., Ashbourn, S. F., Sandford, S. A., & Allamandola, L. J. 2004a, ApJ, 601, 365 [NASA ADS] [CrossRef] [Google Scholar]
- Bernstein, M. P., Bauschlicher, C. W., & Sandford, S. A. 2004b, Adv. Space Res., 33, 40 [NASA ADS] [CrossRef] [Google Scholar]
- Blanch, R. J., & McCluskey, A. 1995, Chem. Phys. Lett., 241, 116 [NASA ADS] [CrossRef] [Google Scholar]
- Boogert, A. C. A., Pontoppidan, K. M., Lahuis, F., et al. 2004, Ap&SS, 154, 359 [Google Scholar]
- Bossa, J., Borget, F., Duvernay, F., Theule, P., & Chiavassa, T. 2008a, J. Phys. Chem. A, 112, 5113 [CrossRef] [PubMed] [Google Scholar]
- Bossa, J. B., Theule, P., Duvernay, F., Borget, F., & Chiavassa, T. 2008b, A&A, 492, 719 [NASA ADS] [CrossRef] [EDP Sciences] [Google Scholar]
- Bossa, J. B., Duvernay, F., Theule, P., et al. 2009a, A&A, 506, 601 [NASA ADS] [CrossRef] [EDP Sciences] [Google Scholar]
- Bossa, J. B., Theule, P., Duvernay, F., & Chiavassa, T. 2009b, ApJ, 707, 1524 [NASA ADS] [CrossRef] [Google Scholar]
- Bossa, J., Borget, F., Duvernay, F., Theule, P., & Chiavassa, T. 2010, J. Phys. Org. Chem., 23, 333 [CrossRef] [Google Scholar]
- Bossa, J., Borget, F., Duvernay, F., et al. 2012, Aust. J. Chem., 65, 129 [CrossRef] [Google Scholar]
- Burke, D. J., & Brown, W. A. 2010, Phys. Chem. Chem. Phys., 12, 5947 [NASA ADS] [CrossRef] [PubMed] [Google Scholar]
- Carter, G. 1962, Vacuum, 12, 245 [CrossRef] [Google Scholar]
- Ceccarelli, C. 2008, Proc. IAU Conf., 4, 79 [CrossRef] [Google Scholar]
- Clutter, D. R., & Thompson, W. E. 1969, J. Chem. Phys., 51, 153 [NASA ADS] [CrossRef] [Google Scholar]
- Commeyras, A., Taillades, J., Collet, H., et al. 2004, Orig. Life Evol. Biosph., 34, 35 [NASA ADS] [CrossRef] [PubMed] [Google Scholar]
- Danger, G., Boiteau, L., Cottet, H., & Pascal, R. 2006, J. Am. Chem. Soc., 128, 7412 [CrossRef] [PubMed] [Google Scholar]
- Danger, G., Borget, F., Chomat, M., et al. 2011a, A&A, 535, A47 [NASA ADS] [CrossRef] [EDP Sciences] [Google Scholar]
- Danger, G., Bossa, J., de Marcellus, P., et al. 2011b, A&A, 525, A30 [NASA ADS] [CrossRef] [EDP Sciences] [Google Scholar]
- Dartois, E. 2005, Space Sci. Rev., 119, 293 [NASA ADS] [CrossRef] [Google Scholar]
- de Marcellus, P., Bertrand, M., Nuevo, M., Westall, F., & Le Sergeant d’Hendecourt, L. 2011, Astrobiology, 11, 847 [NASA ADS] [CrossRef] [Google Scholar]
- Duvernay, F., Dufauret, V., Danger, G., et al. 2010, A&A, 523, A8 [Google Scholar]
- Ehrenfreund, P., & Charnley, S. B. 2000, ARA&A, 38, 427 [Google Scholar]
- Elsila, J. E., Dworkin, J. P., Bernstein, M. P., Martin, M. P., & Sandford, S. A. 2007, ApJ, 660, 911 [NASA ADS] [CrossRef] [Google Scholar]
- Evans, R. A., Lorencak, P., Ha, T. K., & Wentrup, C. 1991, J. Am. Chem. Soc., 113, 7261 [Google Scholar]
- Fraser, H. J., Collings, M. P., McCoustra, M. R. S., & Williams, D. A. 2001, MNRAS, 327, 1165 [NASA ADS] [CrossRef] [Google Scholar]
- Gerakines, P., Moore, M., & Hudson, R. 2004, Icarus, 170, 202 [NASA ADS] [CrossRef] [Google Scholar]
- Greenberg, J. M. 2002, Surf. Sci., 500, 793 [Google Scholar]
- Herbst, E., & van Dishoeck, E. F. 2009, ARA&A, 47, 427 [NASA ADS] [CrossRef] [Google Scholar]
- Herd, C. D. K., Blinova, A., Simkus, D. N., et al. 2011, Science, 332, 1304 [NASA ADS] [CrossRef] [PubMed] [Google Scholar]
- Khare, B., Sagan, C., Thompson, W., et al. 1994, Can. J. Chem., 72, 678 [Google Scholar]
- Koch, D. M., Toubin, C., Peslherbe, G. H., & Hynes, J. T. 2008, J. Phys. Chem. C, 112, 2972 [CrossRef] [Google Scholar]
- Liebman, S., Pesce-Rodriguez, R., & Matthews, C. 1995, Adv. Space Res., 15, 71 [CrossRef] [Google Scholar]
- Lorencak, P., Raabe, G., Radziszewski, J. J., & Wentrup, C. 1986, J. Chem. Soc., Chem. Commun., 916 [Google Scholar]
- Miller, S. L. 1953, Science, 117, 528 [NASA ADS] [CrossRef] [PubMed] [Google Scholar]
- Moore, M. H., & Hudson, R. L. 2003, Icarus, 161, 486 [NASA ADS] [CrossRef] [Google Scholar]
- Pontoppidan, K., Boogert, A., Fraser, H., et al. 2008, ApJ, 678, 1005 [NASA ADS] [CrossRef] [Google Scholar]
- Prasad, S. S., & Tarafdar, S. P. 1983, ApJ, 267, 603 [NASA ADS] [CrossRef] [Google Scholar]
- Redhead, P. 1962, Vacuum, 12, 203 [CrossRef] [Google Scholar]
- Requena-Torres, M. A., Martn-Pintado, J., Rodrguez-Franco, A., et al. 2006, A&A, 455, 15 [Google Scholar]
- Rimola, A., Sodupe, M., & Ugliengo, P. 2010, Phys. Chem. Chem. Phys., 12, 5285 [CrossRef] [PubMed] [Google Scholar]
- Theule, P., Borget, F., Mispelaer, F., et al. 2011, A&A, 534, A64 [NASA ADS] [CrossRef] [EDP Sciences] [Google Scholar]
- Vinogradoff, V., Duvernay, F., Danger, G., Theule, P., & Chiavassa, T. 2011, A&A, 530, A128 [NASA ADS] [CrossRef] [EDP Sciences] [Google Scholar]
- Vinogradoff, V., Duvernay, F., Farabet, M., et al. 2012, J. Phys. Chem. A, 116, 2225 [CrossRef] [Google Scholar]
- Woon, D. E. 2002, ApJ, 571, L177 [NASA ADS] [CrossRef] [Google Scholar]
All Tables
IR spectra for pure NH2CH2CN at 25 K and after 240 min of irradiation at 25 K in our laboratory conditions.
IR absorption bands and assignments of the carbamate NCCH2NHCOO−NCCH2NH formed from the warming of a binary ice mixture NH2CH2CN:CO2=1:3.
Column densities and upper limit of AAN detection in various astrophysical environments.
All Figures
|
Fig. 1 Photochemical and thermal pathways for AAN formation in interstellar ices. |
| In the text | |
|
Fig. 2 FTIR spectrum of pure aminoacetonitrile deposited at 130 K and then recorded at 20 K. |
| In the text | |
|
Fig. 3 Mass spectrum of AAN recorded at 204 K during an annealing ramp of 2 K min-1. |
| In the text | |
|
Fig. 4 Quadruple mass spectrometer temperature-programmed desorption curve (m/z 56) of a pure NH2CH2CN multilayered sample with a 2 K/min temperature ramp rate. The desorption rate was normalized to one-monolayer (1015 molecule cm-2) (dashed line). The solid line is the result of the fit by the zeroth-order Polanyi-Wigner equation. |
| In the text | |
|
Fig. 5 Temperature desorption profile of m/z 18 (H2O) and 56 (AAN) coming from AAN/H2O (1:4) mixture. The ice was warmed with a 5 K min-1 heating rate. |
| In the text | |
|
Fig. 6 Temperature desorption profile of m/z 18 (H2O) and 56 (AAN) coming from AAN/H2O mixture (1:100). The ice was warmed with a 5 K min-1 heating rate. |
| In the text | |
|
Fig. 7 FTIR spectrum of an AAN/H2O ice mixture (1:3) deposited and recorded at 50 K. |
| In the text | |
|
Fig. 8 AAN/H2O (1:3) IR spectrum in the νCN region at (A) pure AAN at 130 K, (B) 170 K, and (C) 180 K. |
| In the text | |
|
Fig. 9 IR spectra of pure aminoacetonitrile at 50 K, pure CO2 at 25 K, (A) AAN/CO2 1:3 at 50 K, and after the warming of ice at (B) 130 K, and (C) 240 K. |
| In the text | |
|
Fig. 10 Mass spectrum obtained during the warming of an initial ice containing AAN/CO2 1:3. |
| In the text | |
|
Fig. 11 IR spectra obtained at 240 K after the warming of an initial ice containing (A) AAN/CO2 1:3, and (B) AAN/CO2/H2O 1:3:3. |
| In the text | |
|
Fig. 12 Diminishing area of the IR feature of AAN (2237 cm-1) with increasing the VUV exposure. The decrease of AAN is fitted against an exponential decay. |
| In the text | |
|
Fig. 13 Difference of IR spectra obtained at 25 K before and after 258 min of VUV irradiation containing pure AAN. |
| In the text | |
|
Fig. 14 Representation of the different possible pathways of degradation of AAN and its carbamate under VUV irradiations. |
| In the text | |
Current usage metrics show cumulative count of Article Views (full-text article views including HTML views, PDF and ePub downloads, according to the available data) and Abstracts Views on Vision4Press platform.
Data correspond to usage on the plateform after 2015. The current usage metrics is available 48-96 hours after online publication and is updated daily on week days.
Initial download of the metrics may take a while.