Fig. 8
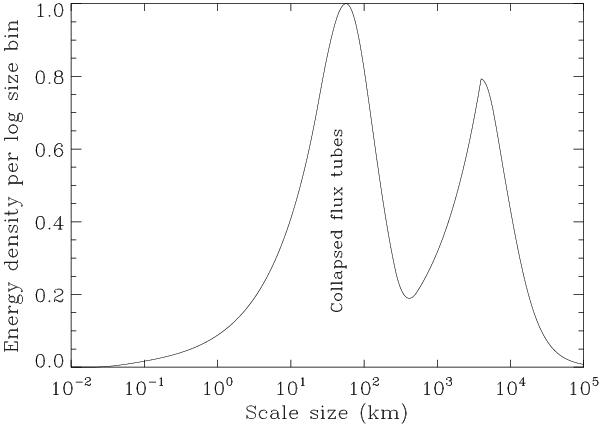
Conversion of the E1D(k) spectrum in Fig. 7 to a histogram that represents the relative amount of magnetic energy in bins of log d, where the scale size d is defined by d = 2π/k. The two bumps in the E1D(k) spectrum now become more pronounced, in particular since we use a linear vertical scale, and the −5/3 power laws get converted into d2/3 functions that govern the shapes of the left sides of the two peaks.
Current usage metrics show cumulative count of Article Views (full-text article views including HTML views, PDF and ePub downloads, according to the available data) and Abstracts Views on Vision4Press platform.
Data correspond to usage on the plateform after 2015. The current usage metrics is available 48-96 hours after online publication and is updated daily on week days.
Initial download of the metrics may take a while.