Fig. 5
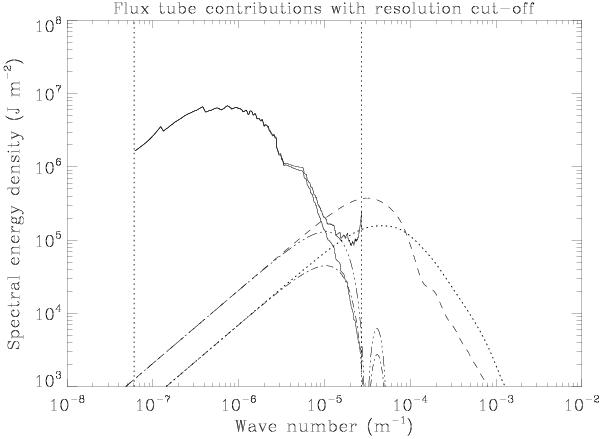
Modeled flux tube contributions to E1D(k) (dashed and dotted curves) based on two somewhat different versions of the flux tube distributions derived in Stenflo (2010). When the MTF of the Hinode telescope, T(k), is applied, the two curves get truncated near the Hinode resolution limit and become the dash-triple-dot and dash-dotted curves. The lower of the two solid curves is identical to the solid curve in Fig. 4. When this curve is divided by T(k) to compensate for the MTF quenching, the upper solid curve is obtained.
Current usage metrics show cumulative count of Article Views (full-text article views including HTML views, PDF and ePub downloads, according to the available data) and Abstracts Views on Vision4Press platform.
Data correspond to usage on the plateform after 2015. The current usage metrics is available 48-96 hours after online publication and is updated daily on week days.
Initial download of the metrics may take a while.