Fig. 2
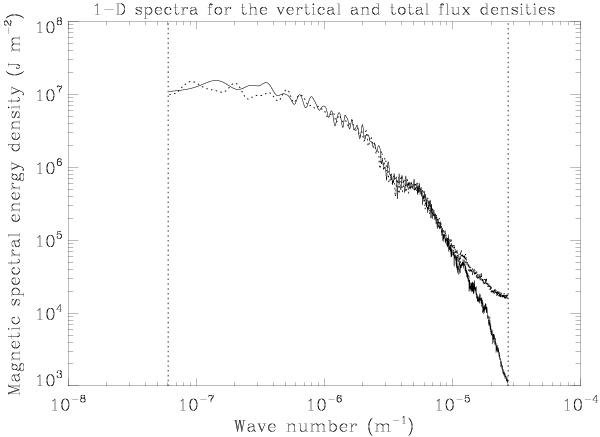
Magnetic energy spectra  for the vertical (solid line) and total (dotted line) flux densities. The solid line is the same as the lowest curve in Fig. 1. The dotted curve agrees with the solid one except at the largest wave numbers, but the deviation there is most likely due to noise (as the transverse Zeeman effect that is used to derive the total flux densities introduces non-Gaussian noise that is much larger than the σobs for the vertical flux densities).
Current usage metrics show cumulative count of Article Views (full-text article views including HTML views, PDF and ePub downloads, according to the available data) and Abstracts Views on Vision4Press platform.
Data correspond to usage on the plateform after 2015. The current usage metrics is available 48-96 hours after online publication and is updated daily on week days.
Initial download of the metrics may take a while.