Fig. 1
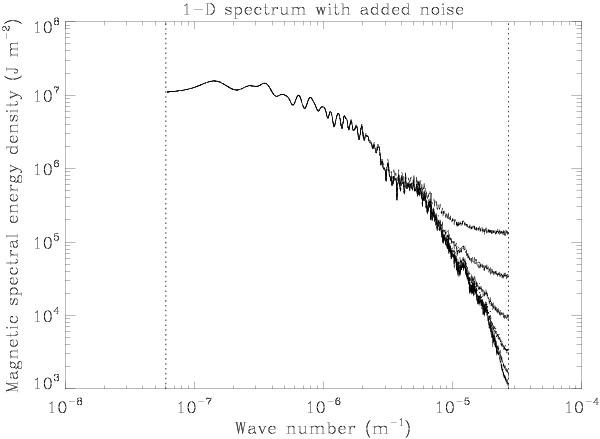
Magnetic energy spectra  of the vertical flux densities, without and with various amounts of random noise added to the original data, for which the measurement noise σobs is 1.4 G. The five curves that deviate increasingly from the original spectrum for the largest wave numbers represent added noise with standard deviations of 1, 2, 4, 8, and 16 × σobs. The dotted lines mark the boundaries of the observed spectrum, determined to the right by the Hinode resolution (0.232 Mm), to the left by the effective slit length (104 Mm).
Current usage metrics show cumulative count of Article Views (full-text article views including HTML views, PDF and ePub downloads, according to the available data) and Abstracts Views on Vision4Press platform.
Data correspond to usage on the plateform after 2015. The current usage metrics is available 48-96 hours after online publication and is updated daily on week days.
Initial download of the metrics may take a while.