Free Access
Fig. 1
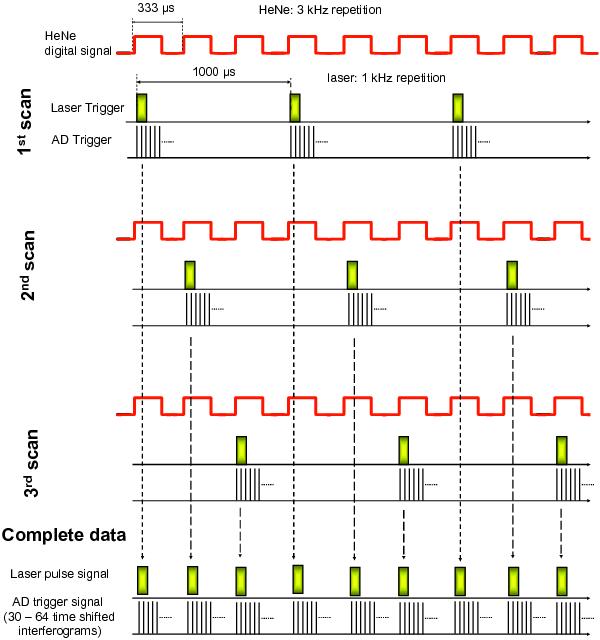
Timing diagram for the interleaved sampling. During the scan, the laser pulse and the AD trigger sampling are induced with a rate of 1/n times of the He–Ne laser fringe frequency. The complete interferograms are obtained after n scans (n = 3 here).
Current usage metrics show cumulative count of Article Views (full-text article views including HTML views, PDF and ePub downloads, according to the available data) and Abstracts Views on Vision4Press platform.
Data correspond to usage on the plateform after 2015. The current usage metrics is available 48-96 hours after online publication and is updated daily on week days.
Initial download of the metrics may take a while.