Free Access
Fig. 4
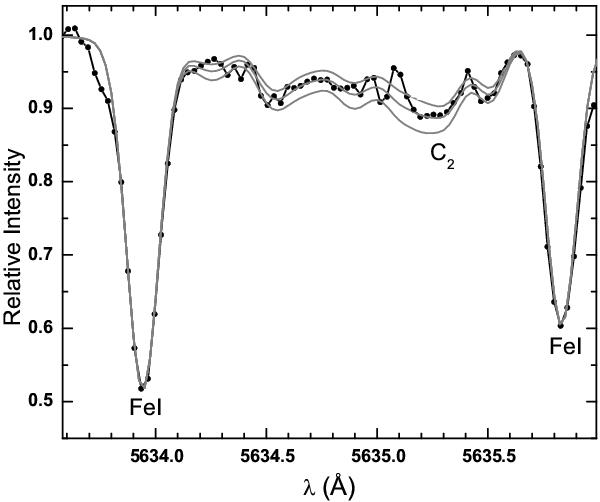
Small region of Cr 261 2001 spectrum (solid black line with black dots) at C2 Swan (0,1) band head 5635.5 Å, plotted together with synthetic spectra with [C/Fe] values of −0.10 dex (lower grey line), −0.15 dex (middle grey line) and −0.20 (upper grey line).
Current usage metrics show cumulative count of Article Views (full-text article views including HTML views, PDF and ePub downloads, according to the available data) and Abstracts Views on Vision4Press platform.
Data correspond to usage on the plateform after 2015. The current usage metrics is available 48-96 hours after online publication and is updated daily on week days.
Initial download of the metrics may take a while.