Free Access
Fig. 4
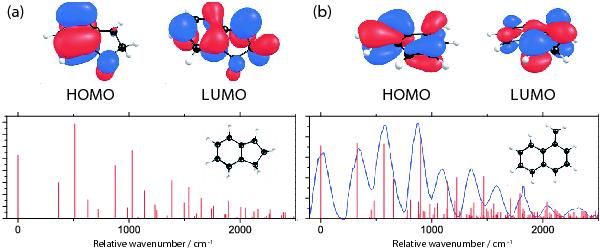
a) Simulated FC profile of the S0 → S1 transitions of indanylium; and illustrations of its calculated equilibrium structure and HOMO and LUMO isosurfaces (0.03 cutoff). b) Same as a), but for 1-naphthylmethylium. The experimental spectrum was taken from Nagy et al. (2011b).
Current usage metrics show cumulative count of Article Views (full-text article views including HTML views, PDF and ePub downloads, according to the available data) and Abstracts Views on Vision4Press platform.
Data correspond to usage on the plateform after 2015. The current usage metrics is available 48-96 hours after online publication and is updated daily on week days.
Initial download of the metrics may take a while.