Free Access
Fig. 8
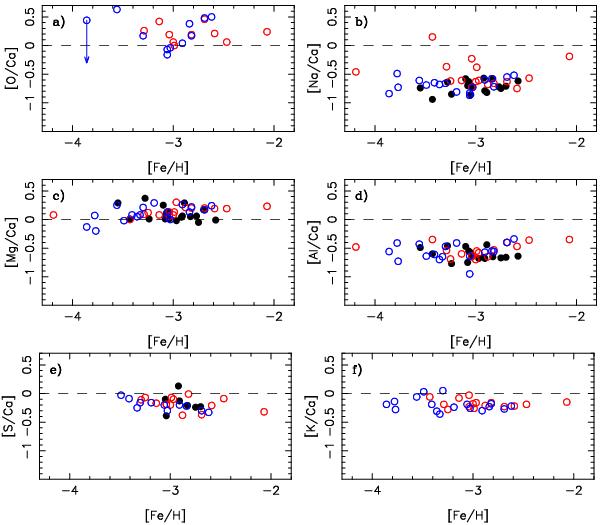
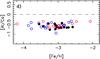
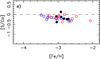
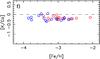
Abundance ratios of O, Na, Mg, Al, S, and K relative to Ca in the early Galaxy. The abundances of all these elements were computed taking into account the NLTE effect. The black dots represent the turnoff stars, the open circles the giants (blue for the unmixed giants and red for the mixed giants).
This figure is made of several images, please see below:
Current usage metrics show cumulative count of Article Views (full-text article views including HTML views, PDF and ePub downloads, according to the available data) and Abstracts Views on Vision4Press platform.
Data correspond to usage on the plateform after 2015. The current usage metrics is available 48-96 hours after online publication and is updated daily on week days.
Initial download of the metrics may take a while.