Fig. 5
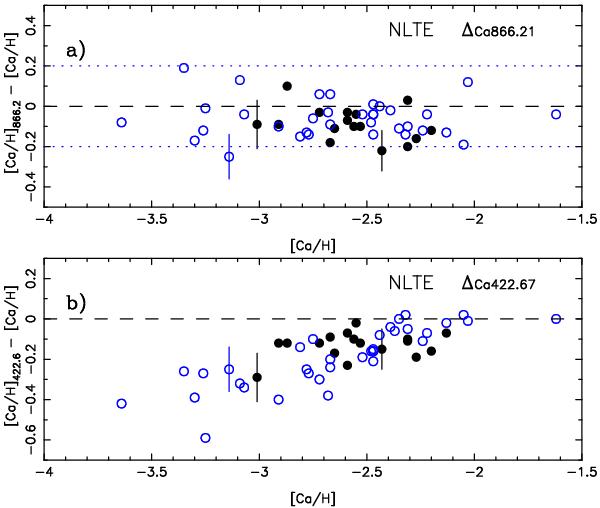
Difference between [Ca/H] deduced from the subordinate lines of Ca I and [Ca/H] deduced from a) the infrared triplet of Ca II and b) the resonance line of Ca I. The filled circles represent the turnoff stars and the open symbols the giants. The error bar on [Ca/H], Δ Ca 866.21 and Δ Ca 422.67 is generally less than 0.1dex. It is indicated only when it exceeds 0.1 dex. a) The Ca abundance deduced from the line of the infrared triplet is, as a mean, 0.07 dex lower than the abundance derived from the subordinate lines of Ca I. b) For [Ca / H] ≈ − 2, the abundance deduced from the Ca I resonance line agrees quite well with the abundances deduced from subordinate lines, but a discrepancy appears and increases linearly when [Ca/H] decreases. It reaches about 0.4 dex for [Ca/H]= –3.5.
Current usage metrics show cumulative count of Article Views (full-text article views including HTML views, PDF and ePub downloads, according to the available data) and Abstracts Views on Vision4Press platform.
Data correspond to usage on the plateform after 2015. The current usage metrics is available 48-96 hours after online publication and is updated daily on week days.
Initial download of the metrics may take a while.