Fig. 3
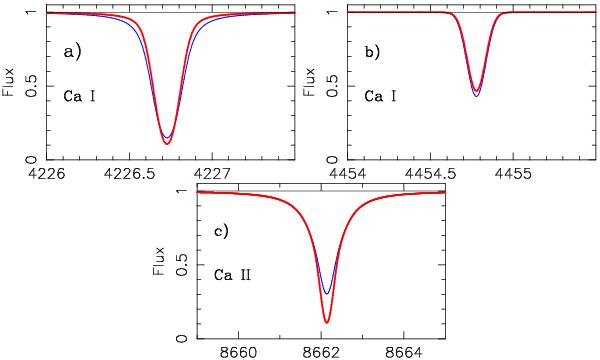
Profiles of three Ca lines computed for a giant star with [Ca / H] ≈ − 2.5 with LTE (thin blue line) and NLTE (thick red line) hypotheses. The wavelengths are given in Å. a) The NLTE profile of the Ca I resonance line is narrower in the wings and deeper in the core. b) In a Ca I subordinate line, for the same abundance of calcium the equivalent width computed under the NLTE hypothesis is slightly smaller. c) The NLTE correction is important for the strong IR Ca II line (note that the scale in wavelength is different for this line), but the wings are not affected and a reliable calcium abundance can be deduced from these wings via LTE analysis.


Current usage metrics show cumulative count of Article Views (full-text article views including HTML views, PDF and ePub downloads, according to the available data) and Abstracts Views on Vision4Press platform.
Data correspond to usage on the plateform after 2015. The current usage metrics is available 48-96 hours after online publication and is updated daily on week days.
Initial download of the metrics may take a while.