Free Access
Fig. 1
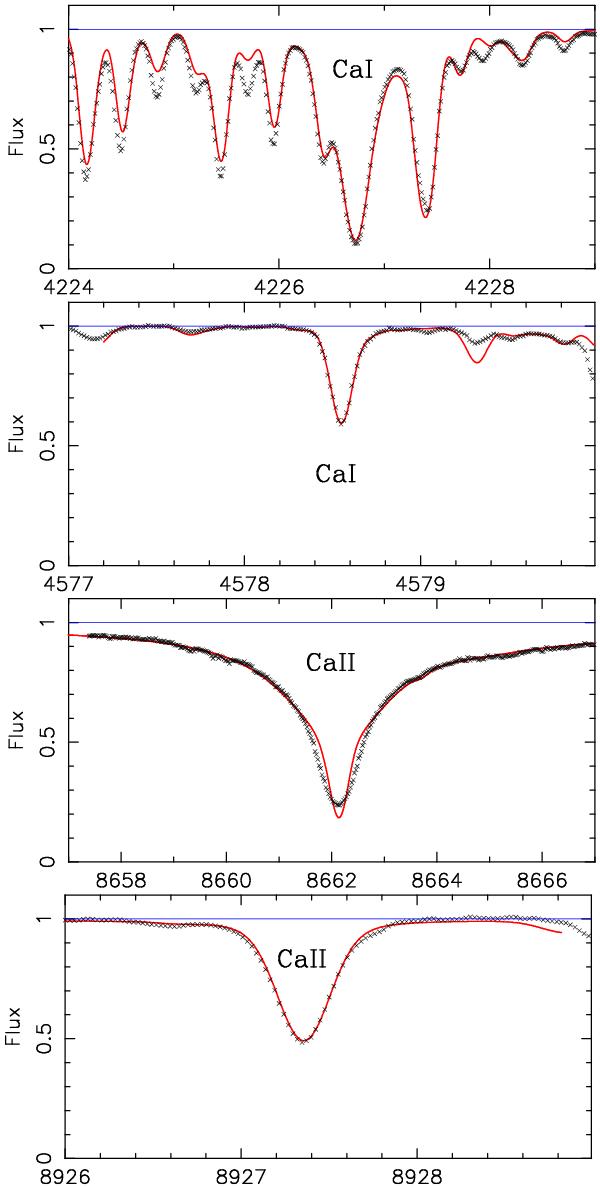
Profiles of Ca I and Ca II lines in Procyon. The wavelengths are in Å. The small crosses represent the observed spectrum and the (red) line the computed profile. With our model atom, the observed and computed profiles of the Ca I and Ca II lines agree well.
This figure is made of several images, please see below:


Current usage metrics show cumulative count of Article Views (full-text article views including HTML views, PDF and ePub downloads, according to the available data) and Abstracts Views on Vision4Press platform.
Data correspond to usage on the plateform after 2015. The current usage metrics is available 48-96 hours after online publication and is updated daily on week days.
Initial download of the metrics may take a while.