Fig. 15
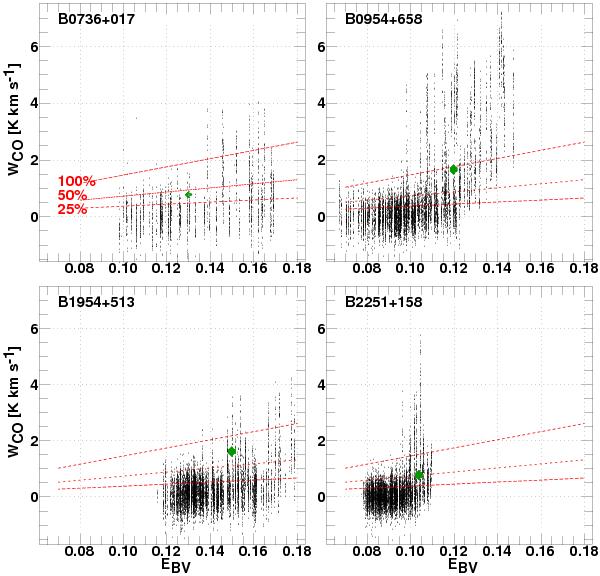
Distribution of EB − V and WCO for four fields mapped here in CO. Each 20′′ pixel in the CO maps is plotted as a separate point. The (red) dashed lines in each panel show the CO emission expected if 25%, 50% and 100% of the gas is in molecular form with a typical value of the WCO-N(H2) conversion factor, N(H2)/WCO = 2 × 10²⁰ H2 cm-2 (K km s-1)-1. In each panel a (green) filled diamond is shown at the value given in Table 1 toward the background source.
Current usage metrics show cumulative count of Article Views (full-text article views including HTML views, PDF and ePub downloads, according to the available data) and Abstracts Views on Vision4Press platform.
Data correspond to usage on the plateform after 2015. The current usage metrics is available 48-96 hours after online publication and is updated daily on week days.
Initial download of the metrics may take a while.