Fig. 7
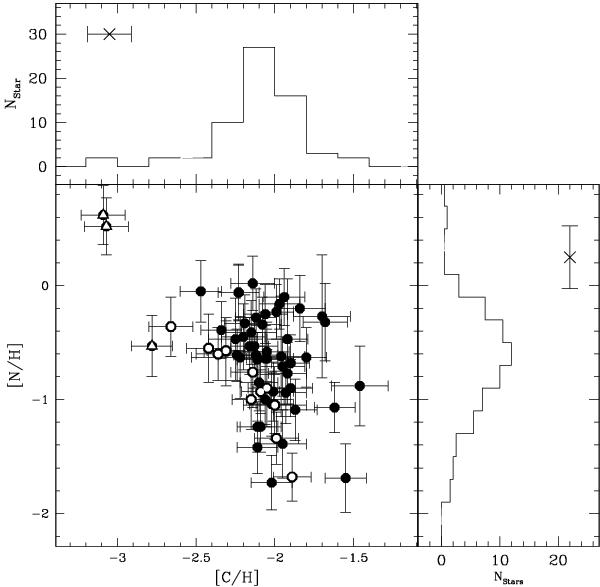
[C/H] and [N/H] abundances for the NGC1851 SGB, TO and MS stars in Table 2 are plotted. A C versus N anticorrelation is evident. Stars that have already experienced some mixing episode are shown as large white dots, while three notable outliers are represented as large triangles (see text for comments). Histograms of [N/H] and [C/H] with typical median error bars are also plotted in this figure.
Current usage metrics show cumulative count of Article Views (full-text article views including HTML views, PDF and ePub downloads, according to the available data) and Abstracts Views on Vision4Press platform.
Data correspond to usage on the plateform after 2015. The current usage metrics is available 48-96 hours after online publication and is updated daily on week days.
Initial download of the metrics may take a while.